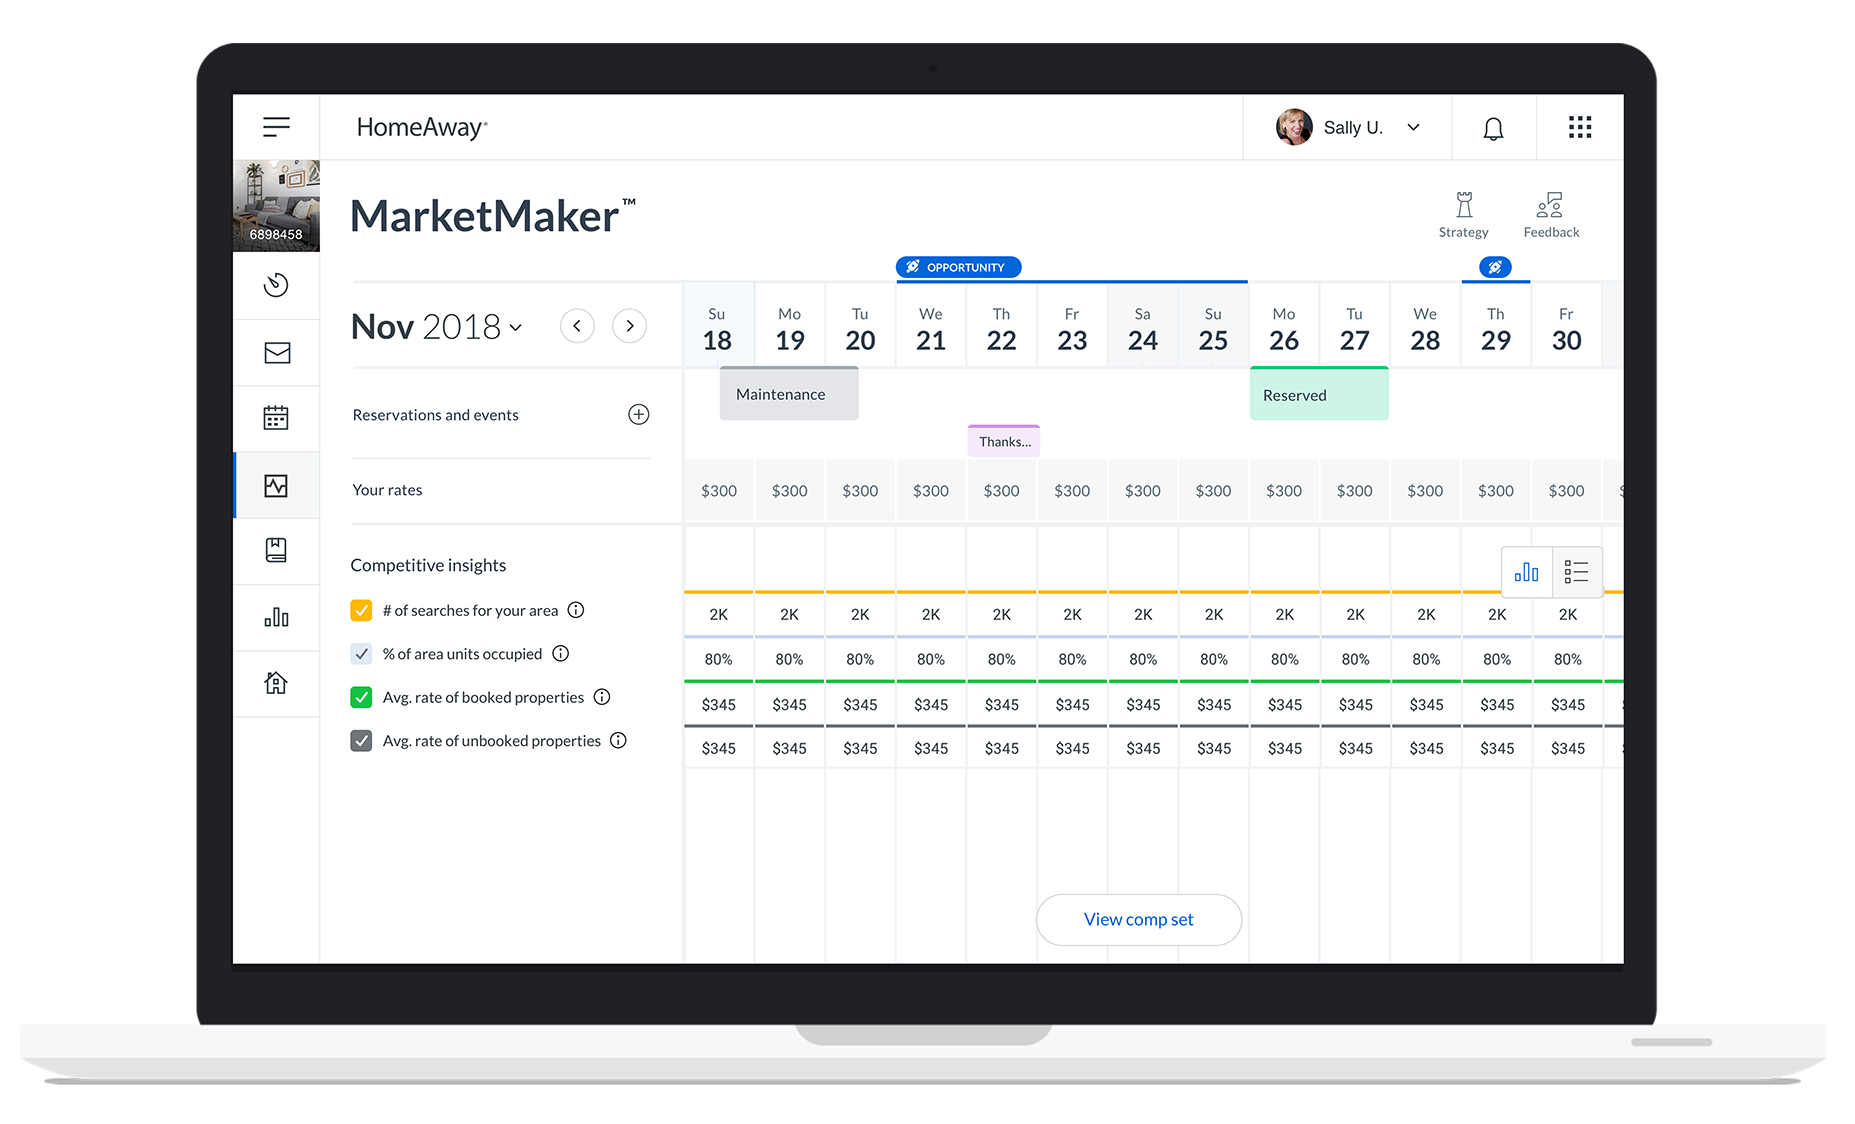
MarketMaker aims to leverage the unique travel data available across Expedia and Vrbo to enable vacation rental owners to make informed decisions on their properties’ availability, and price. This helps them meet their revenue goals through data-driven recommendations and simple design.
Leading UX/UI, I teamed up with a variety of roles and teams including design leadership, product management, engineers, research, content strategy, design technologists, data science, and marketing to build a comprehensive experience that was innovative and easy to use for our owners and property managers.
YEAR
November 2016 - February 2020
MY ROLE
Sr. Product Designer
Lead Product Designer
Sr. Product Design Manager
Success metrics captured after launch
700K owners enacting their rate decisions from MarketMaker.
Owners taking advantage of MarketMaker recommendations, increased booked nights by 33%
Owners who accepted MarketMaker recommendations saw an increase in revenue by 26%
PROBLEM
Vacation rental owners often had no easy access to education and data for pricing in their markets. The process to get any data was manual and time-consuming, often resulting in the need for hiring additional employees. Owners and HomeAway (Vrbo) are losing out on potential revenue due to sub-optimal pricing affecting booked nights and revenue per night.
By showing owners real-time market insights, similar properties in their market, and rate recommendations based on their goals, we will save them time, increase retention, and create a positive impact on the marketplace.
PROCESS
I started working with our research team to better understand how owners set their rates and the tools they used. We also explored rate recommendation tools already offered by other products. We focused on how well those products solved the core problem for rate recommendations. One of the patterns we noticed was that there was no product at the time offering clear explanations alongside their rate recommendations.
Research themes
1
Our current rates editor was cumbersome and time consuming.
2
Often first time owners do not know what to charge for their VR.
3
Time consuming to manually scrape OTA sites for rate data.
4
No trust for rate recommendations with no data to back them up.
5
Some owners don’t have time or care about editing their rates.
STRATEGY
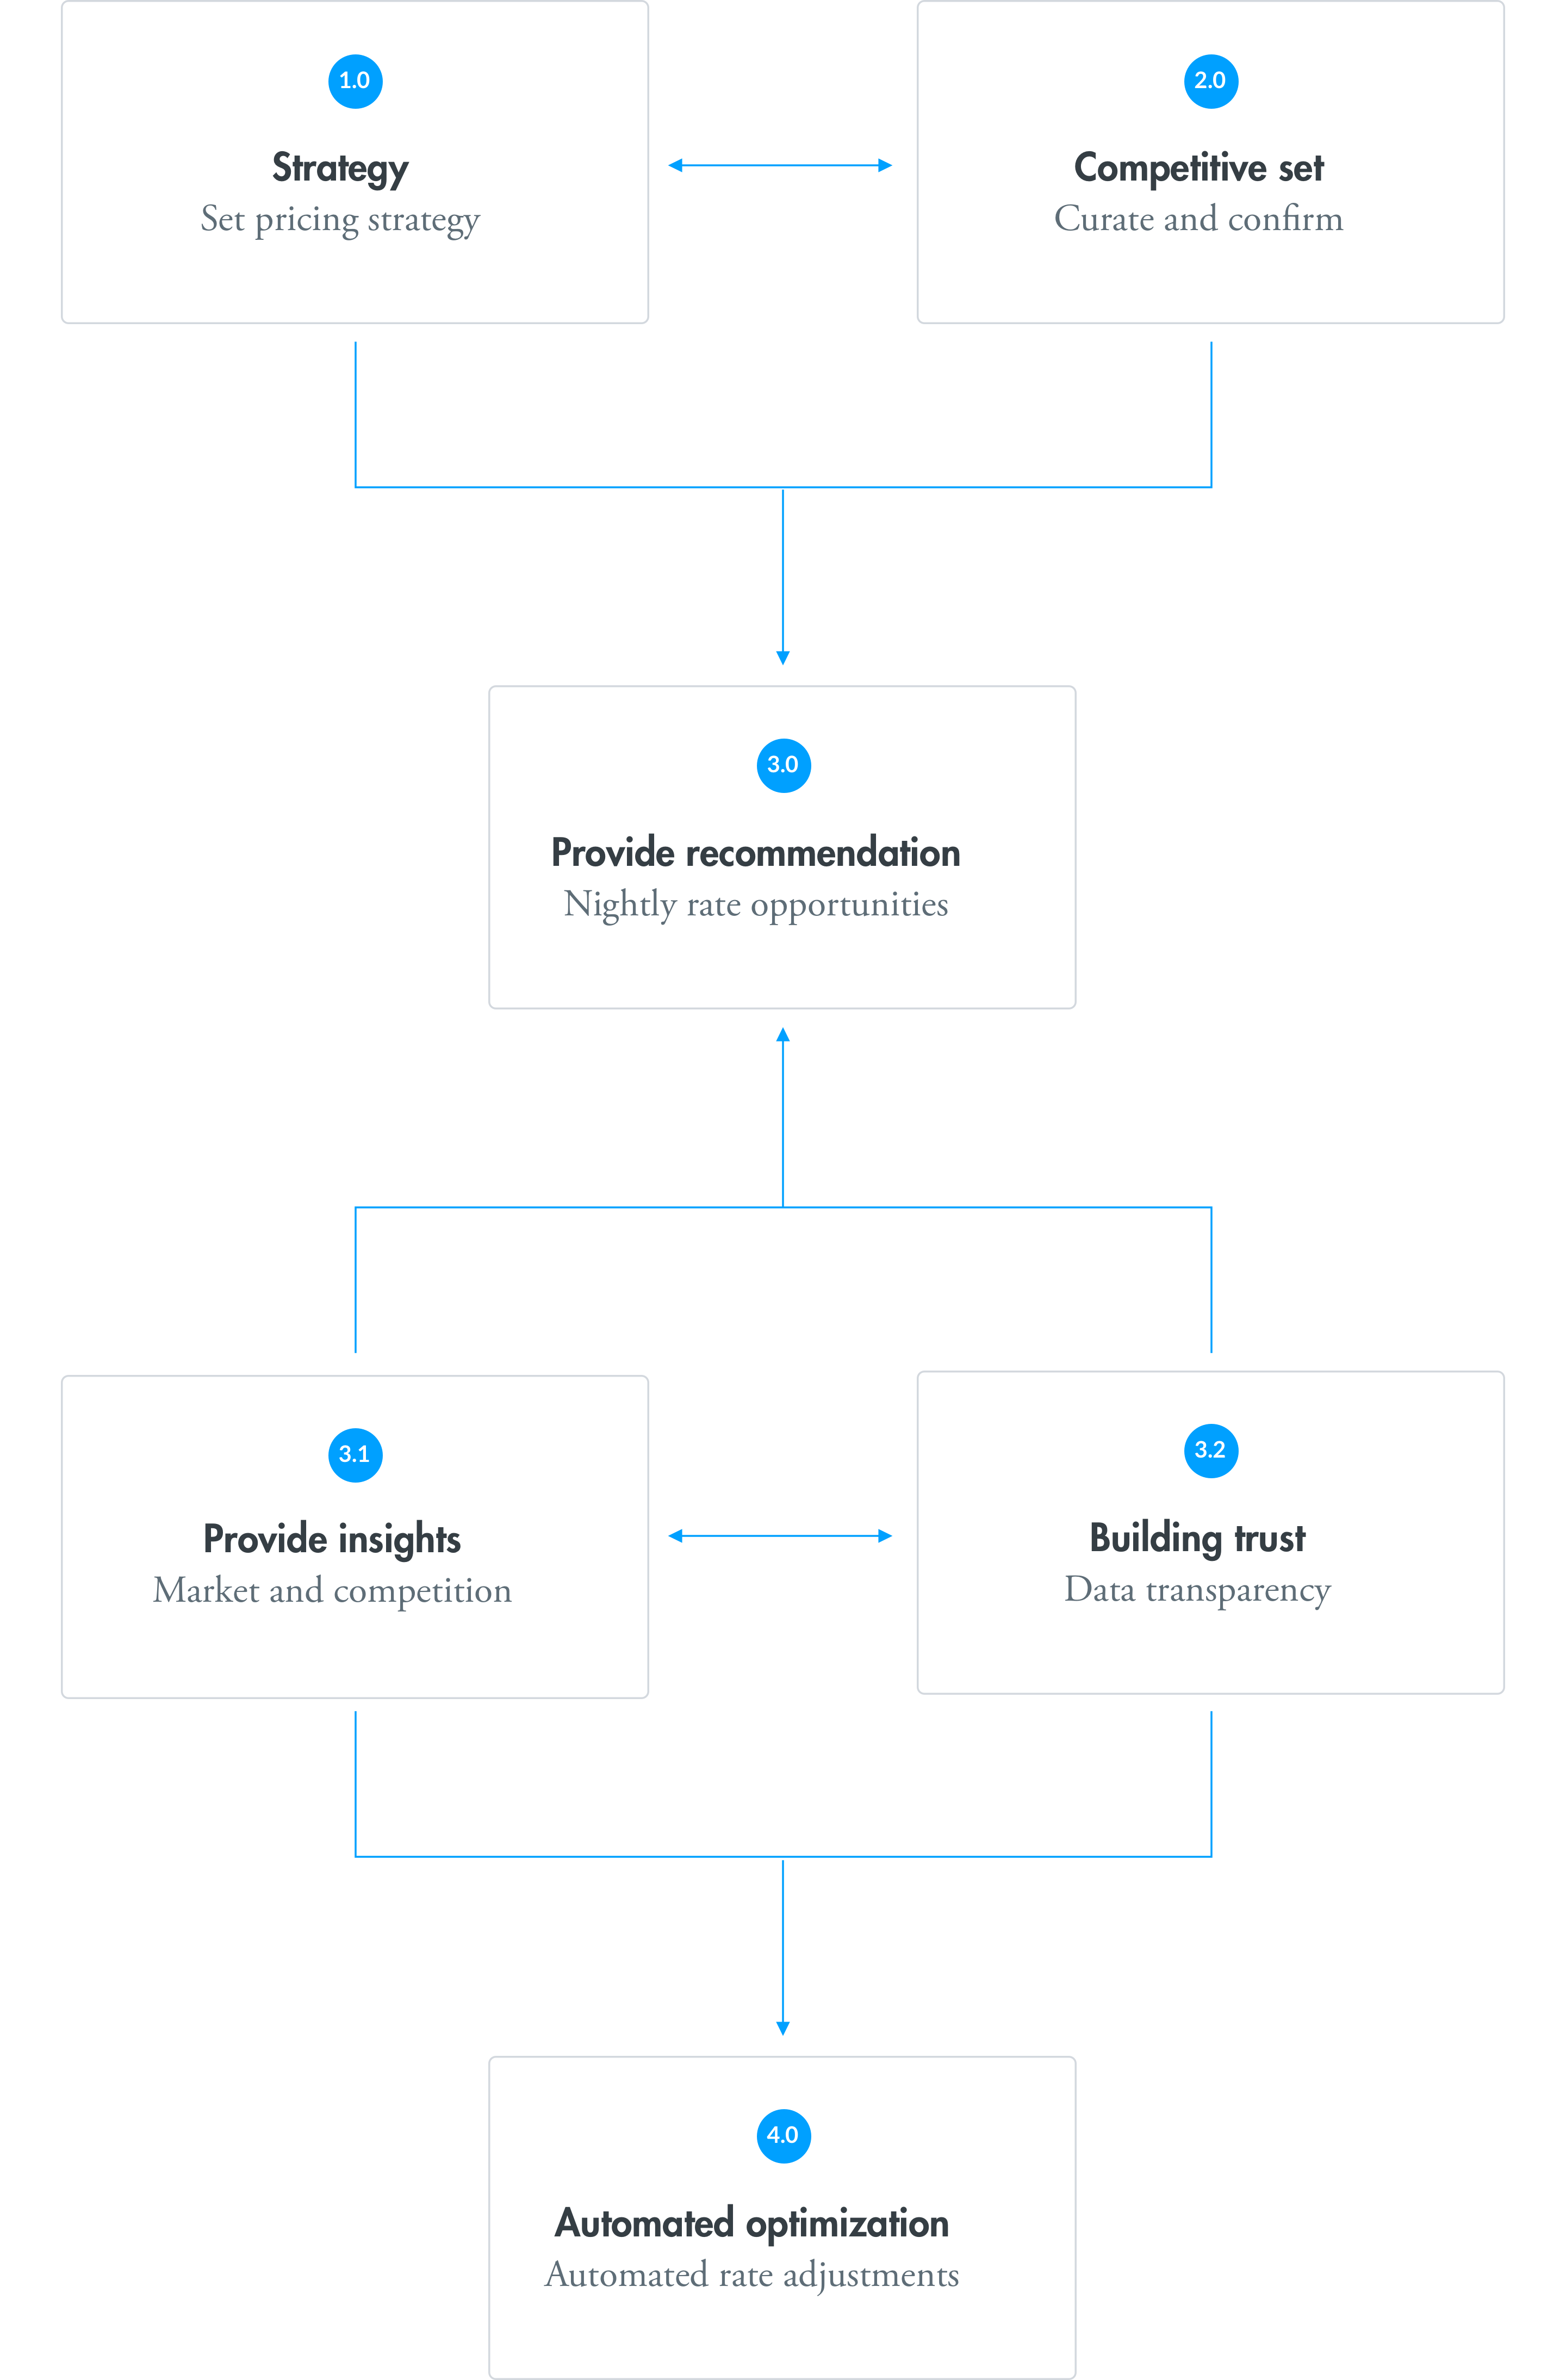
Automated rate recommendations. The most important goal to getting to automation is to build trust with Owners and Property Managers. MarketMaker is the foundation for accepting one-click rate recommendations.
“How are you getting these rate recommendations?”
“Who are you comparing me to?”
We added two features to address these initial concerns:
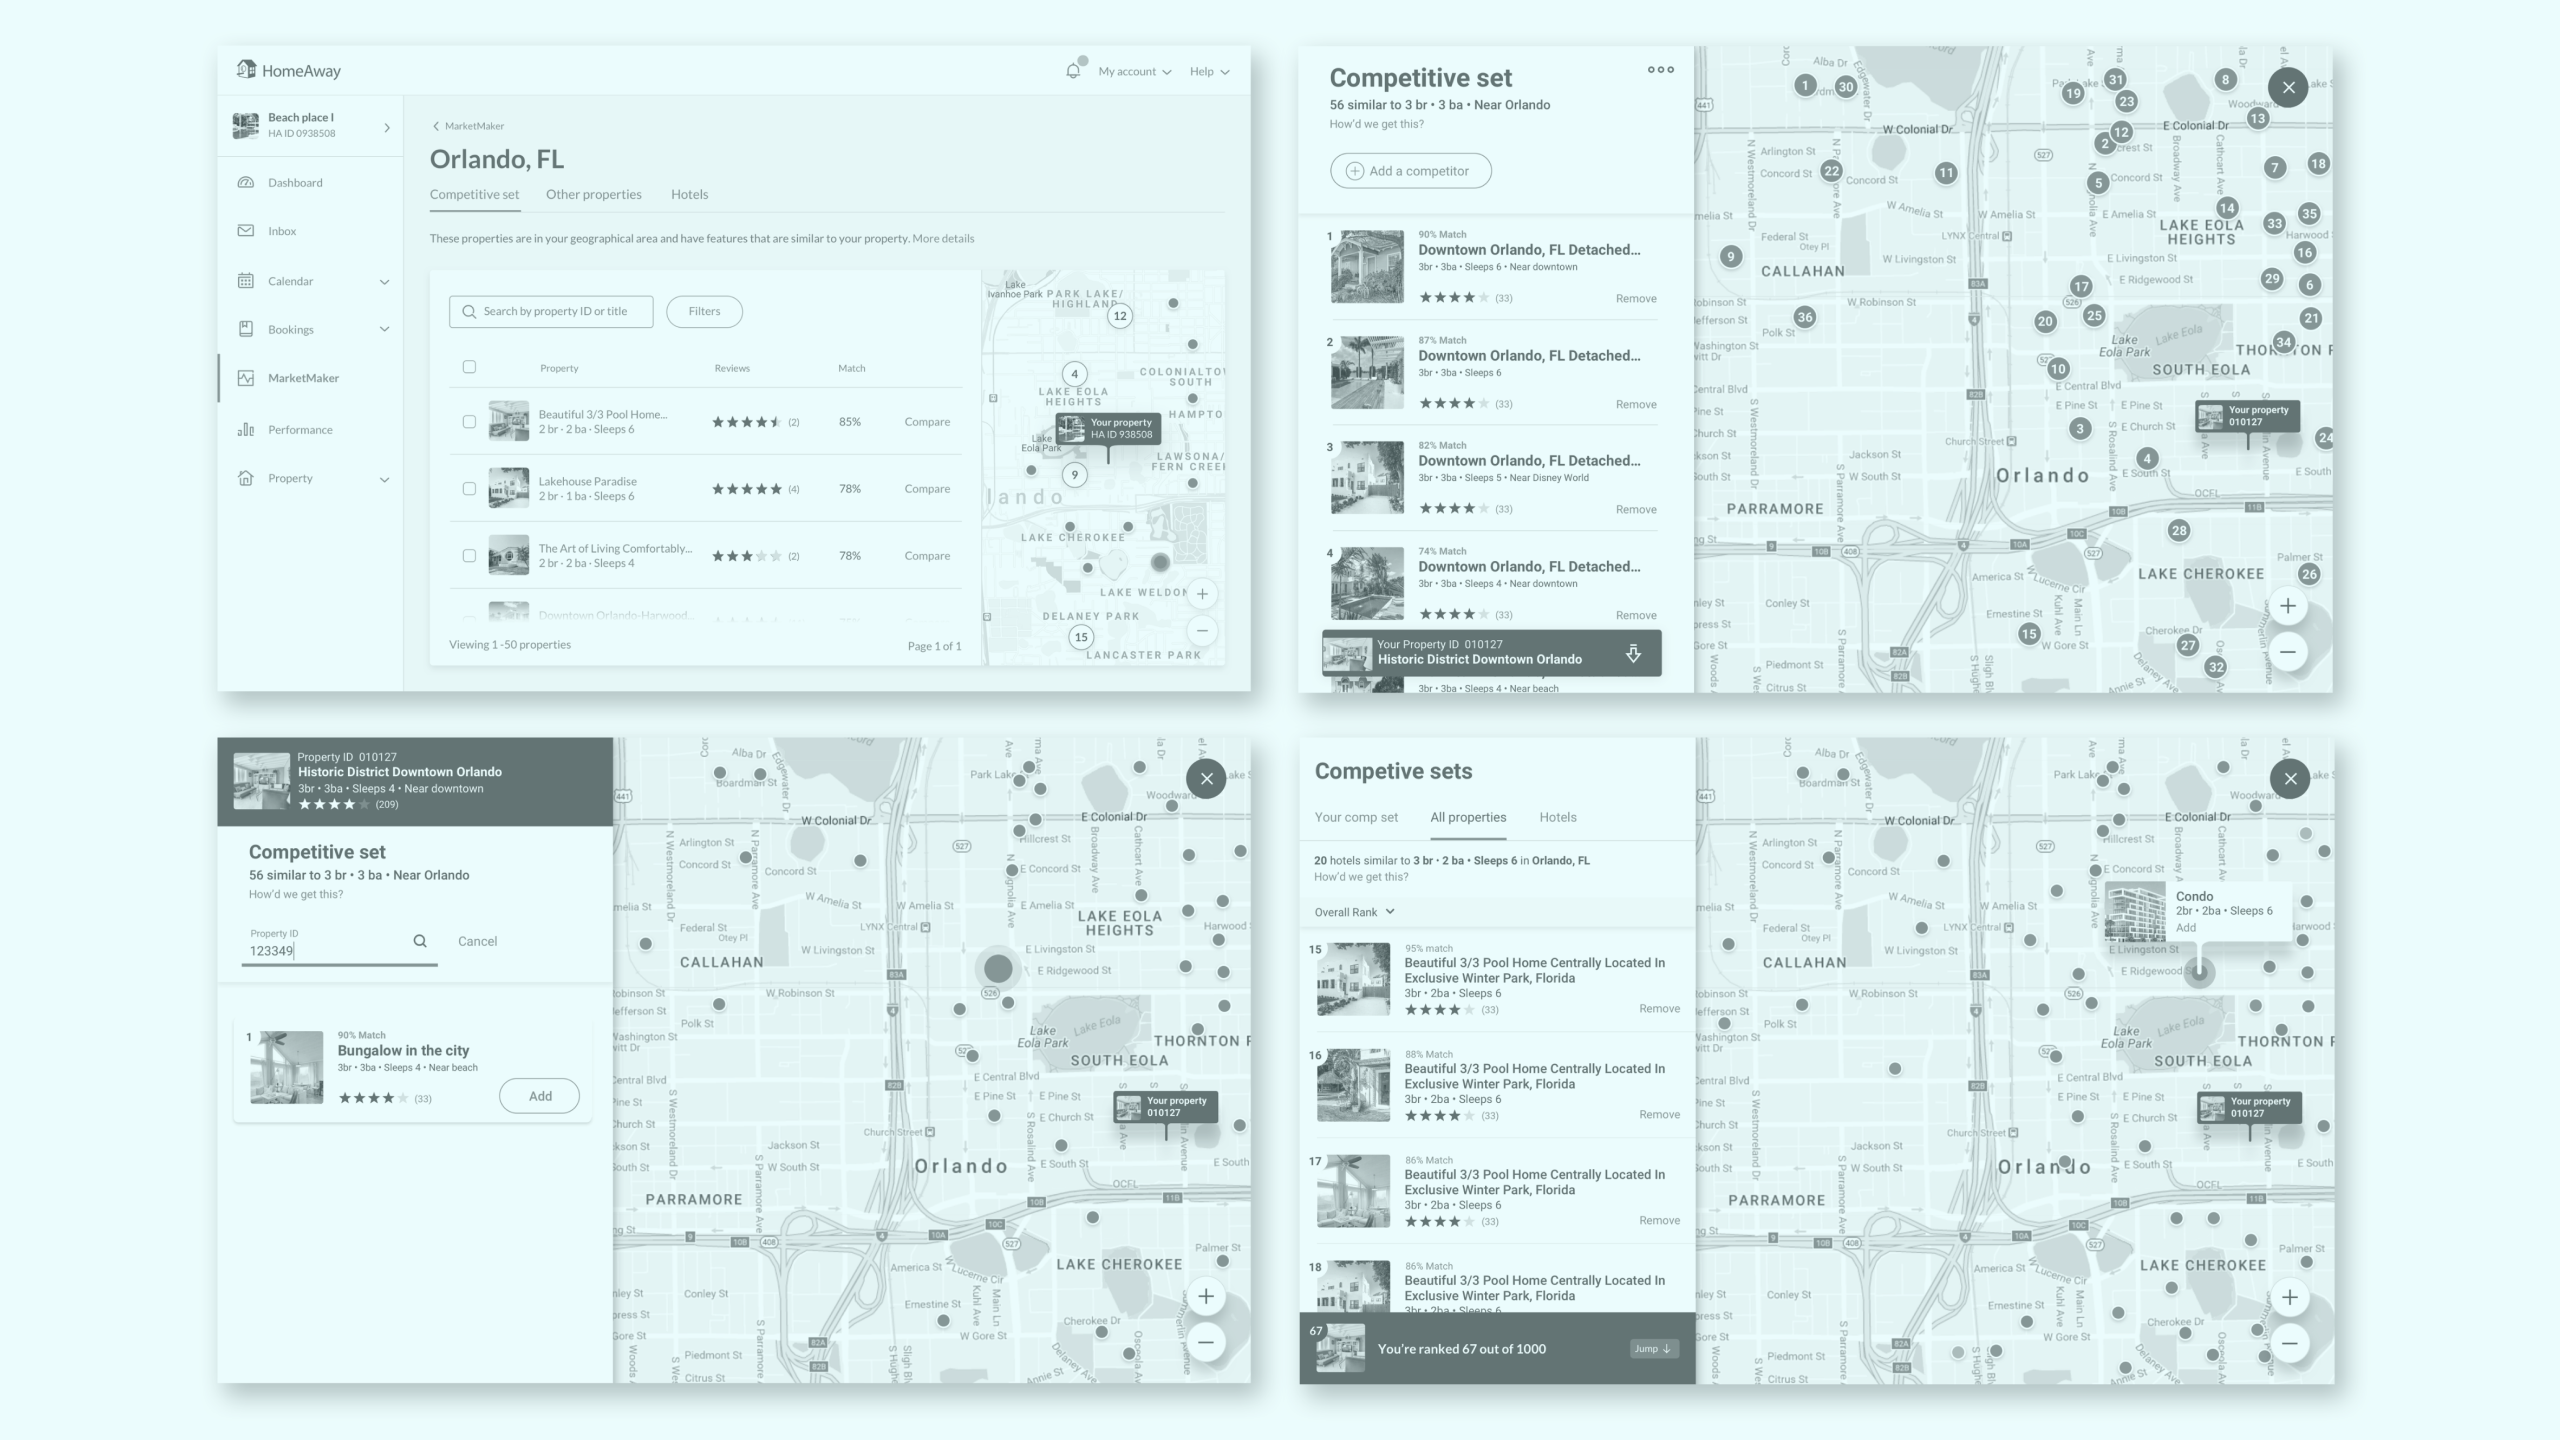
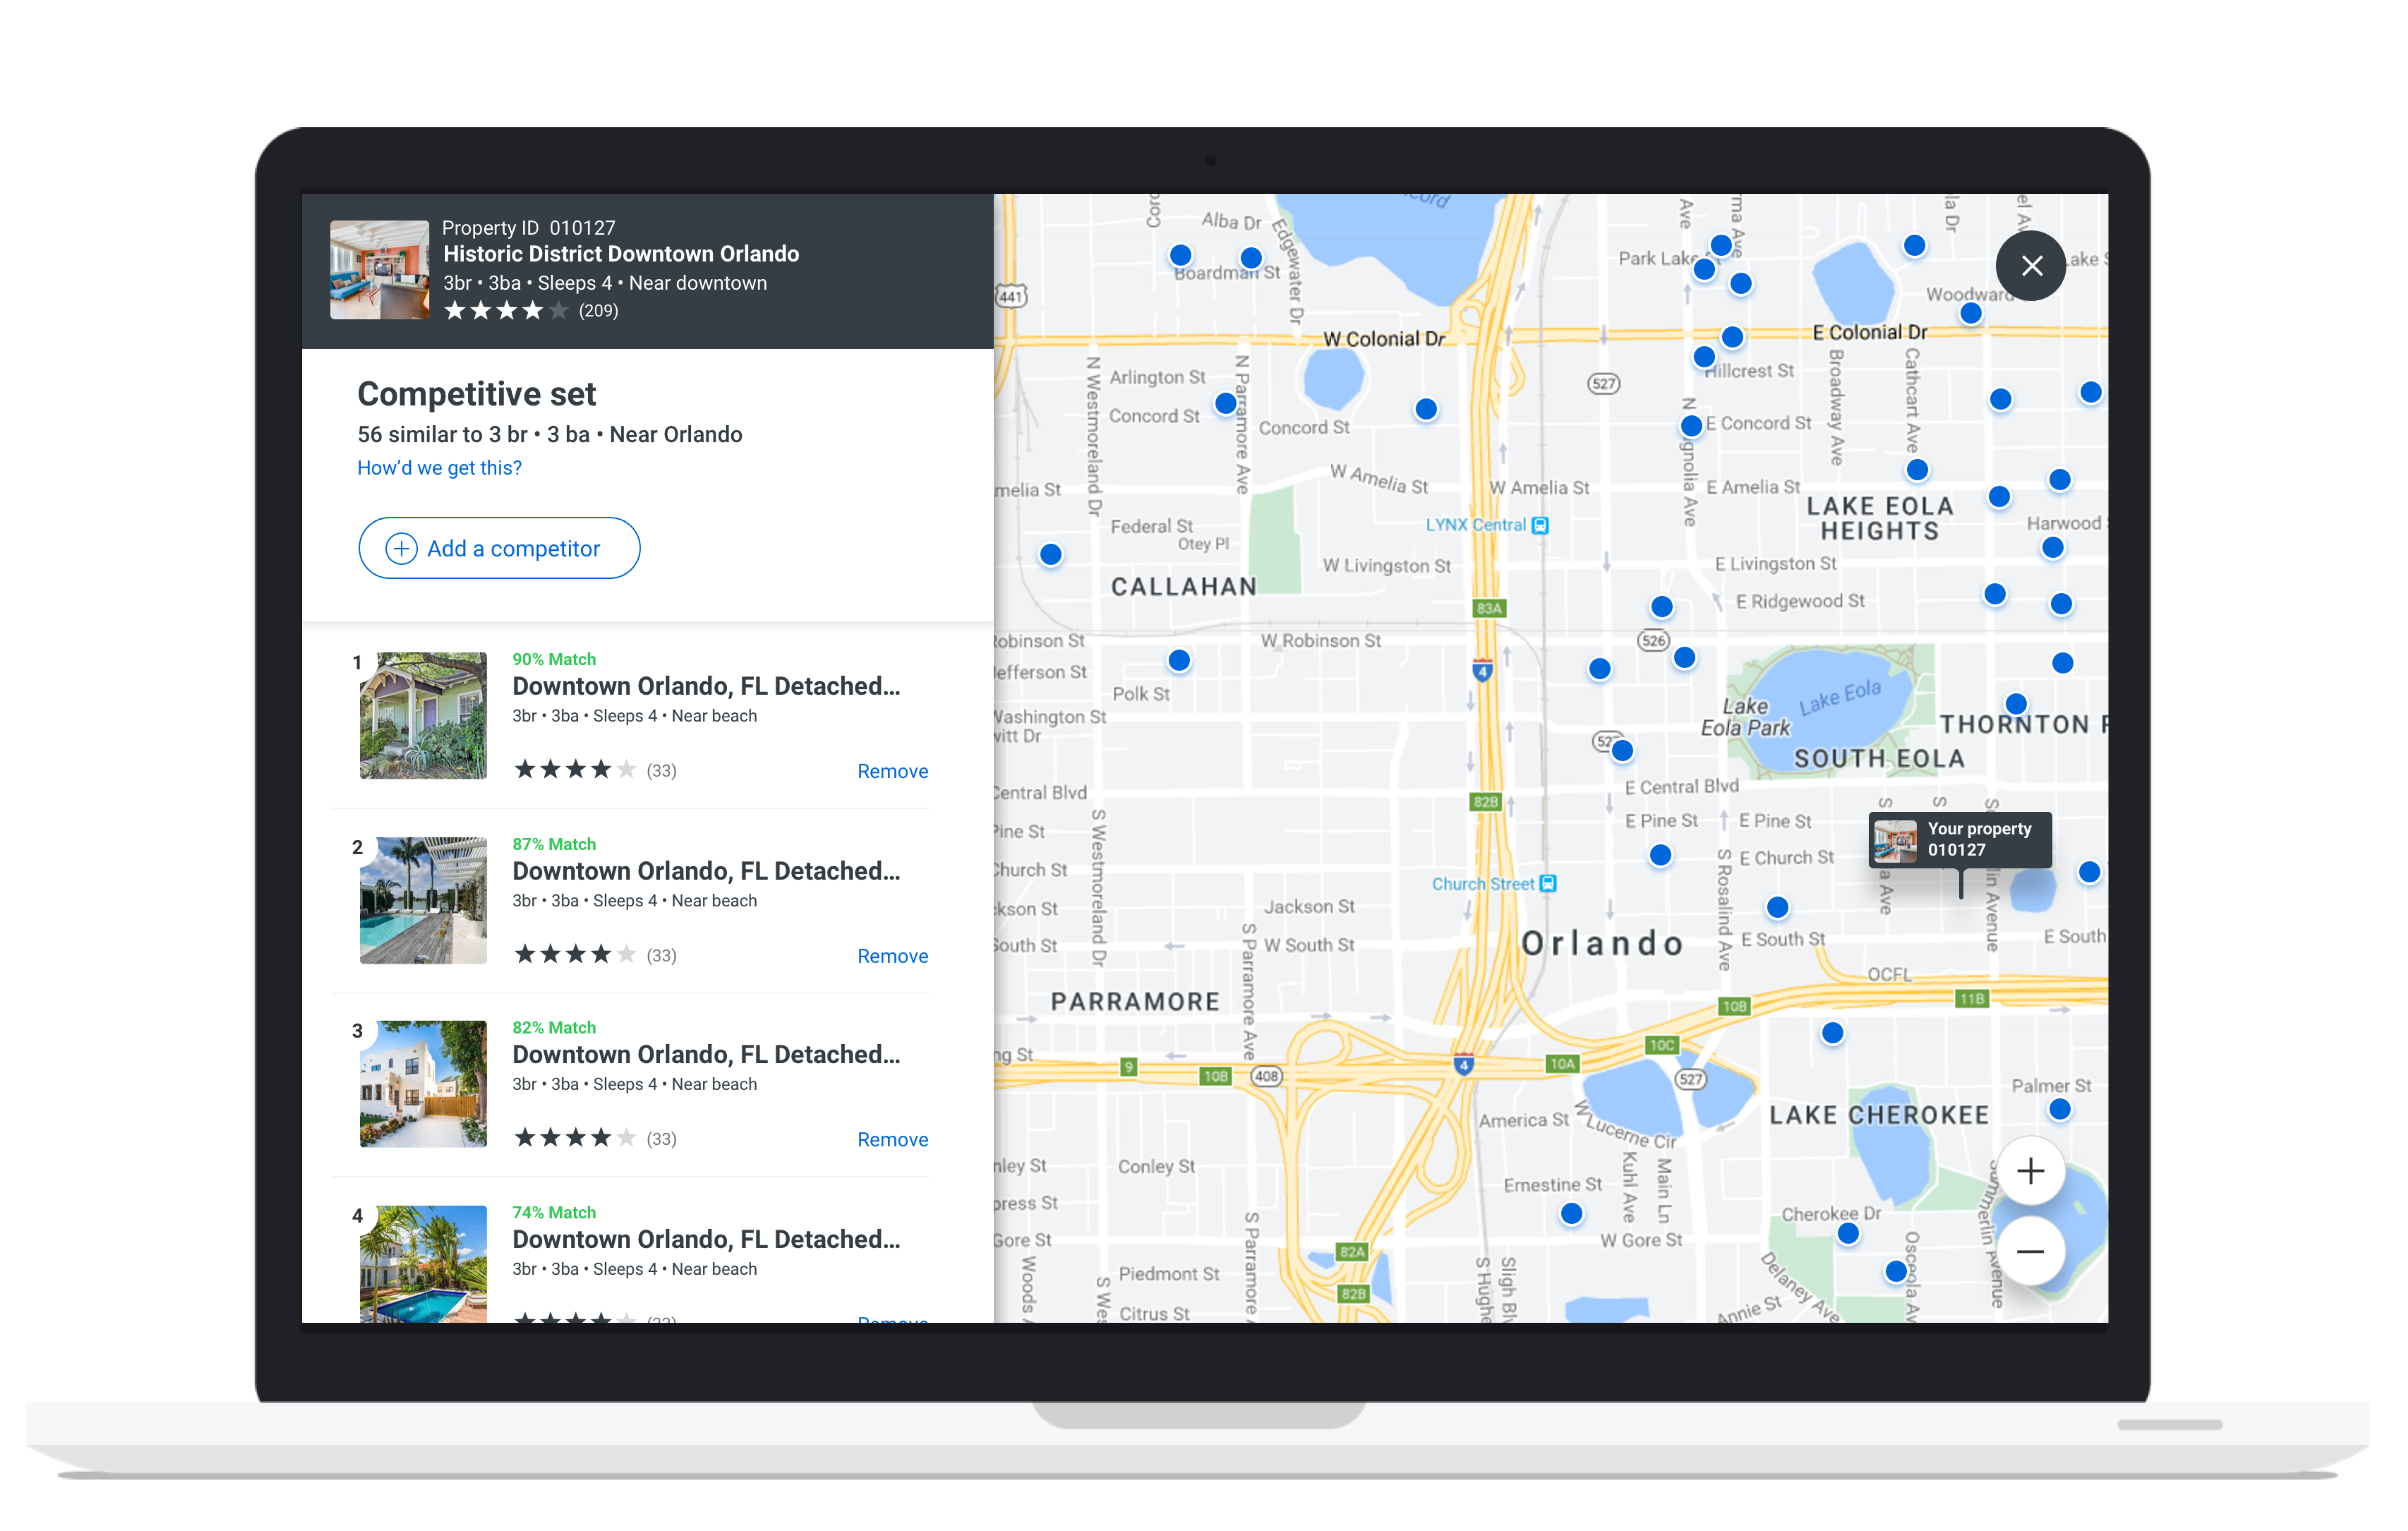
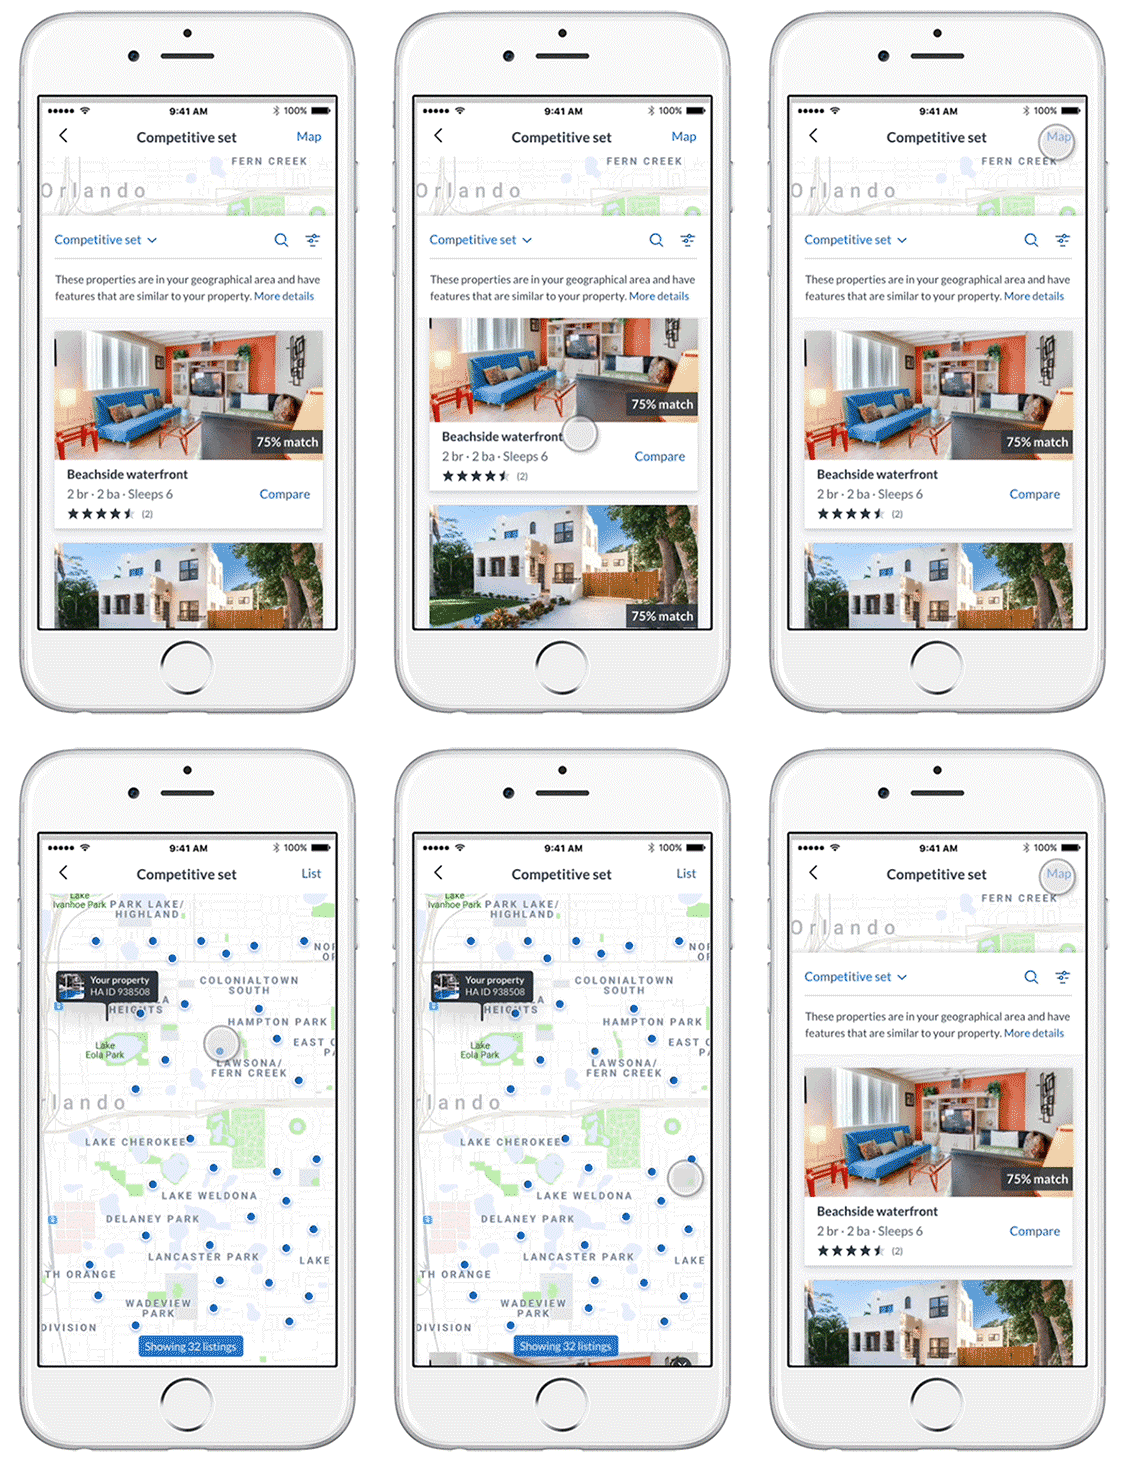
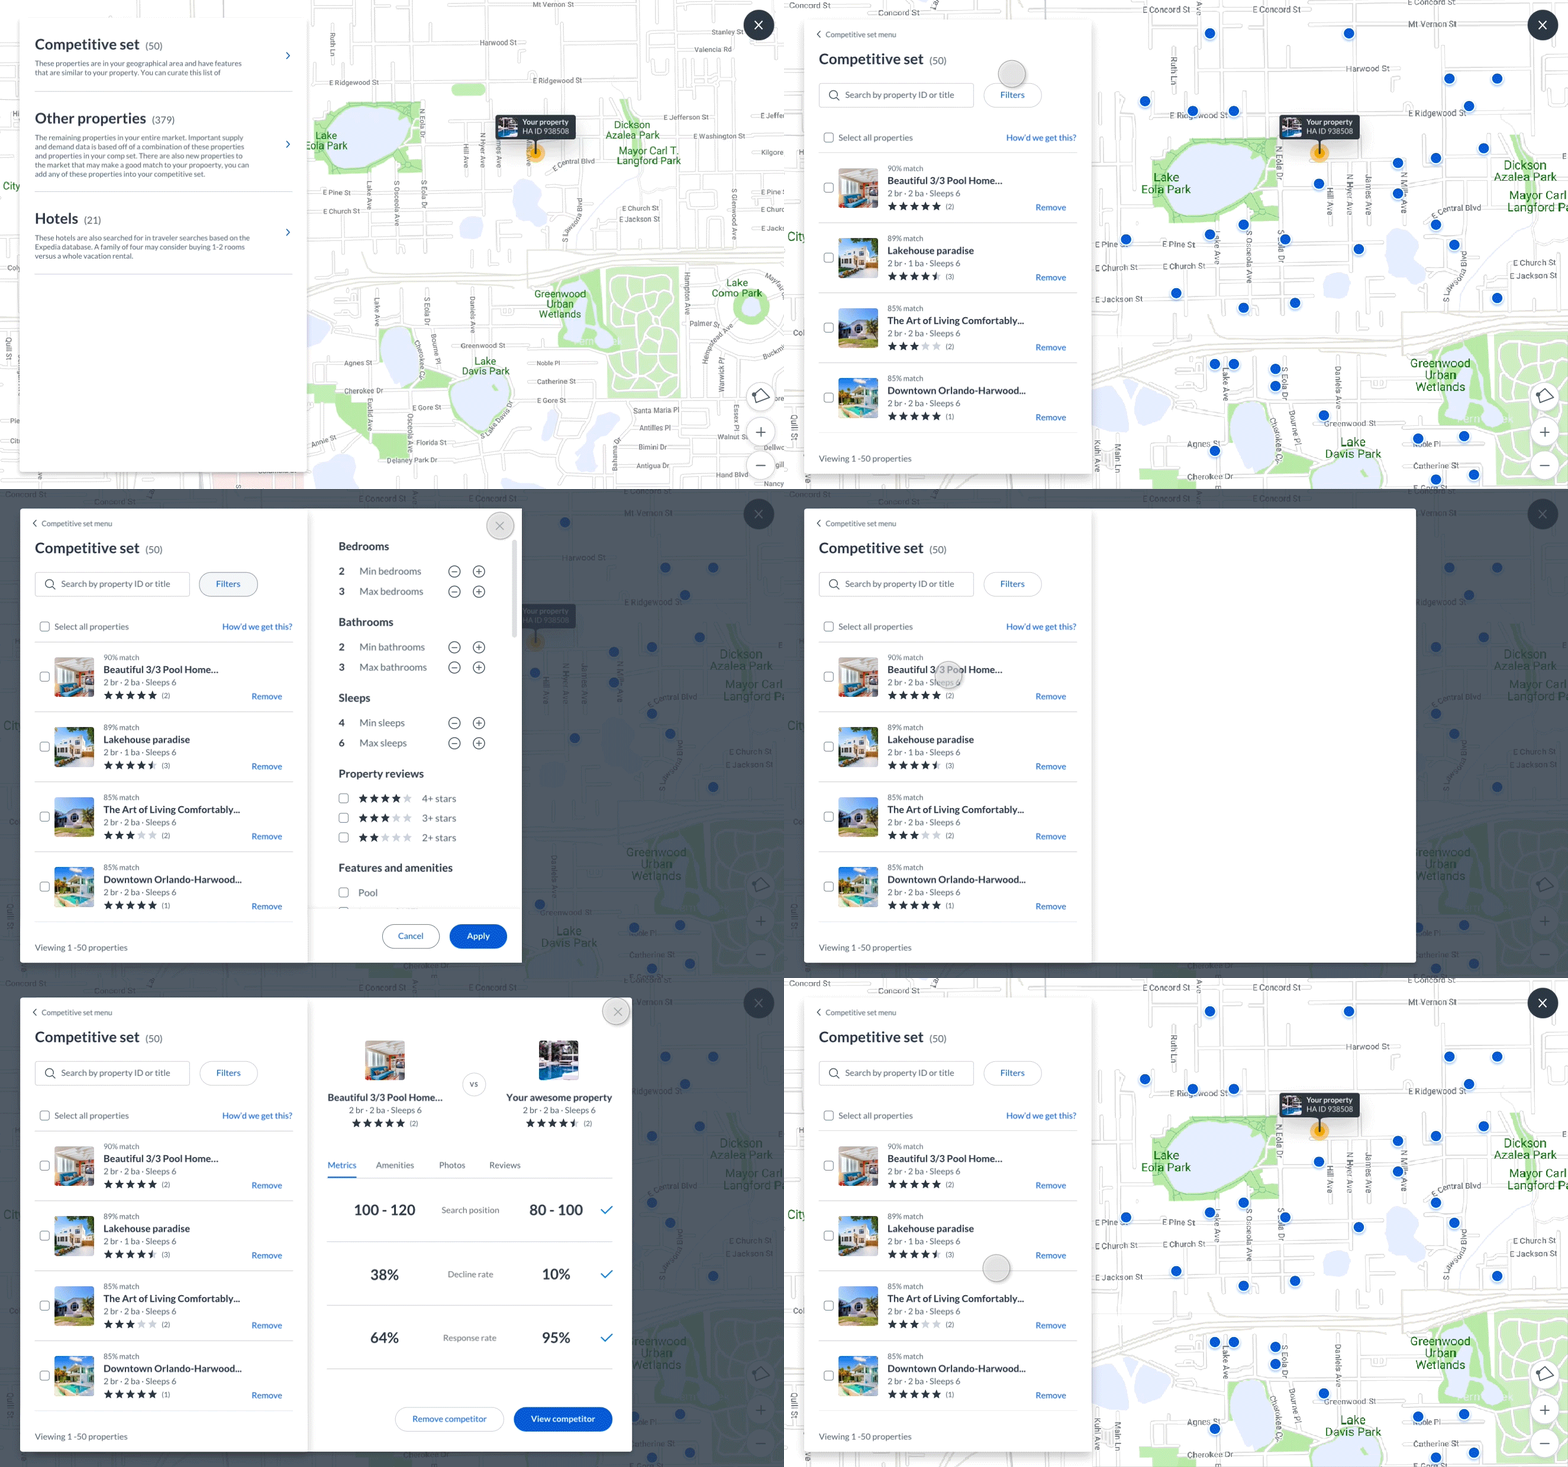
Competitive Set is a customizable list/ map of similar properties that travelers also viewed. The list is based on what travelers are searching for: the number of bedrooms, bathrooms, and amenities. The comp set will dictate market data shown in MarketMaker and our performance tool.
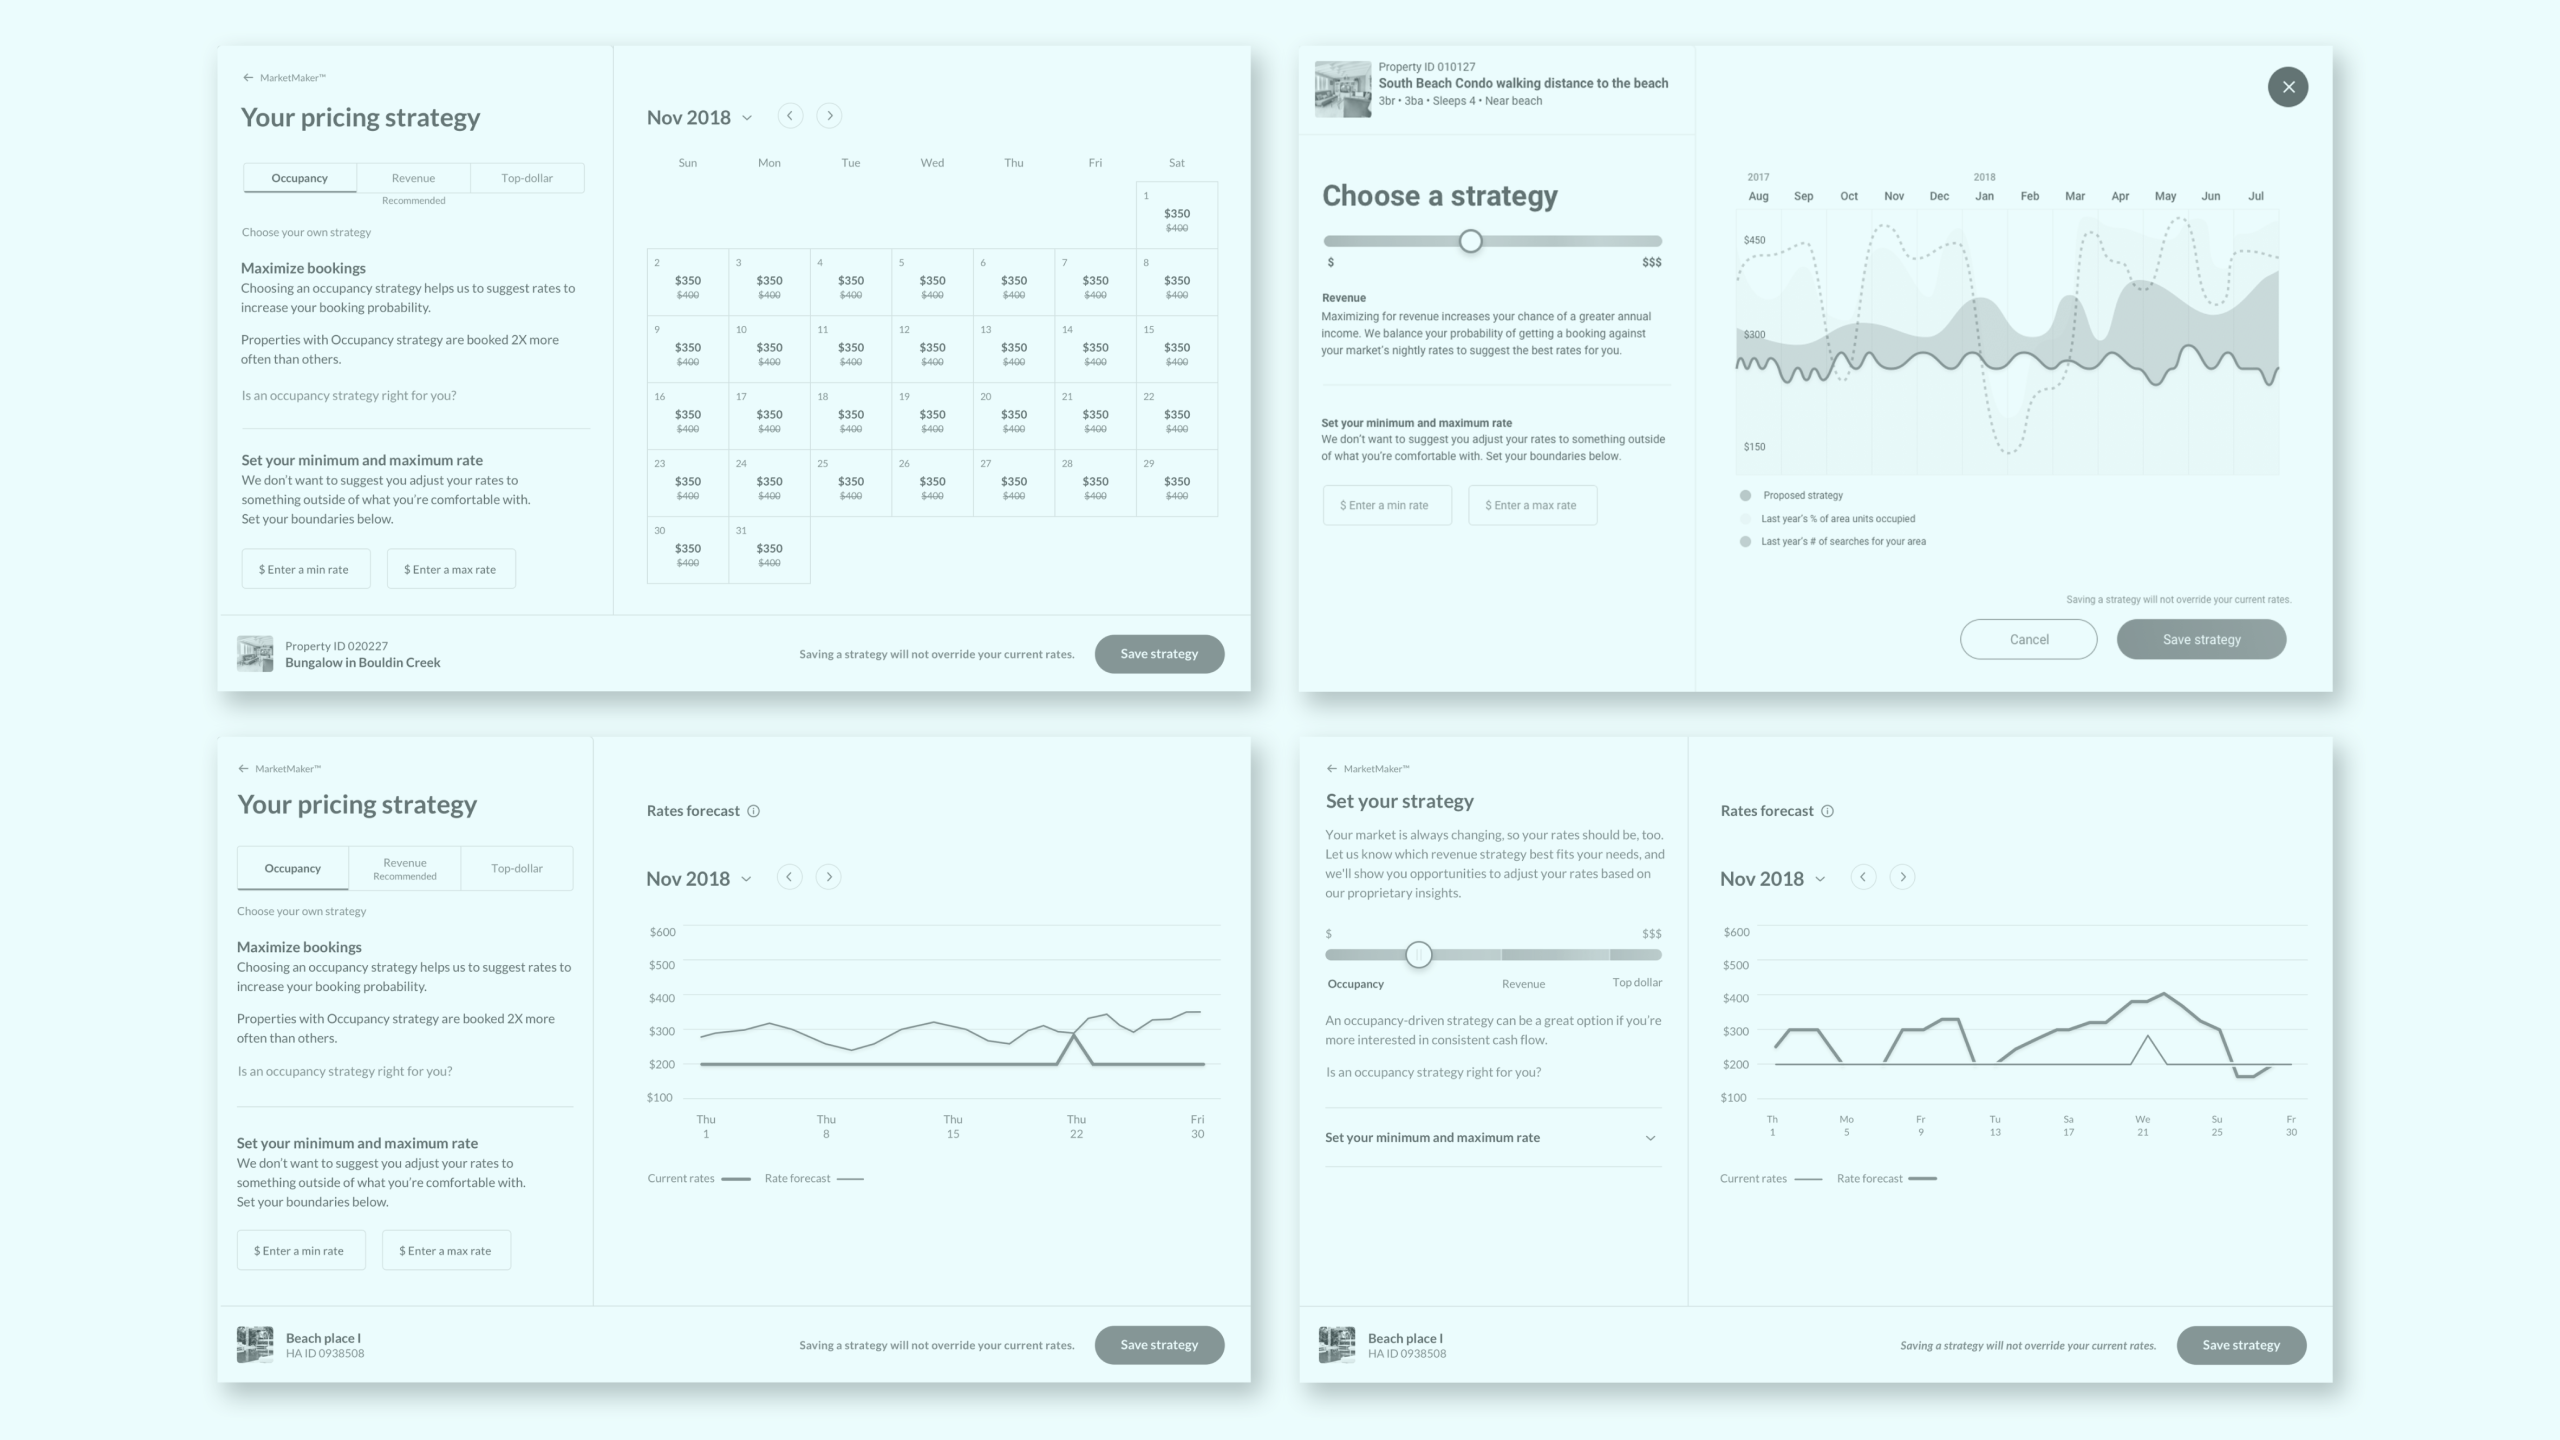
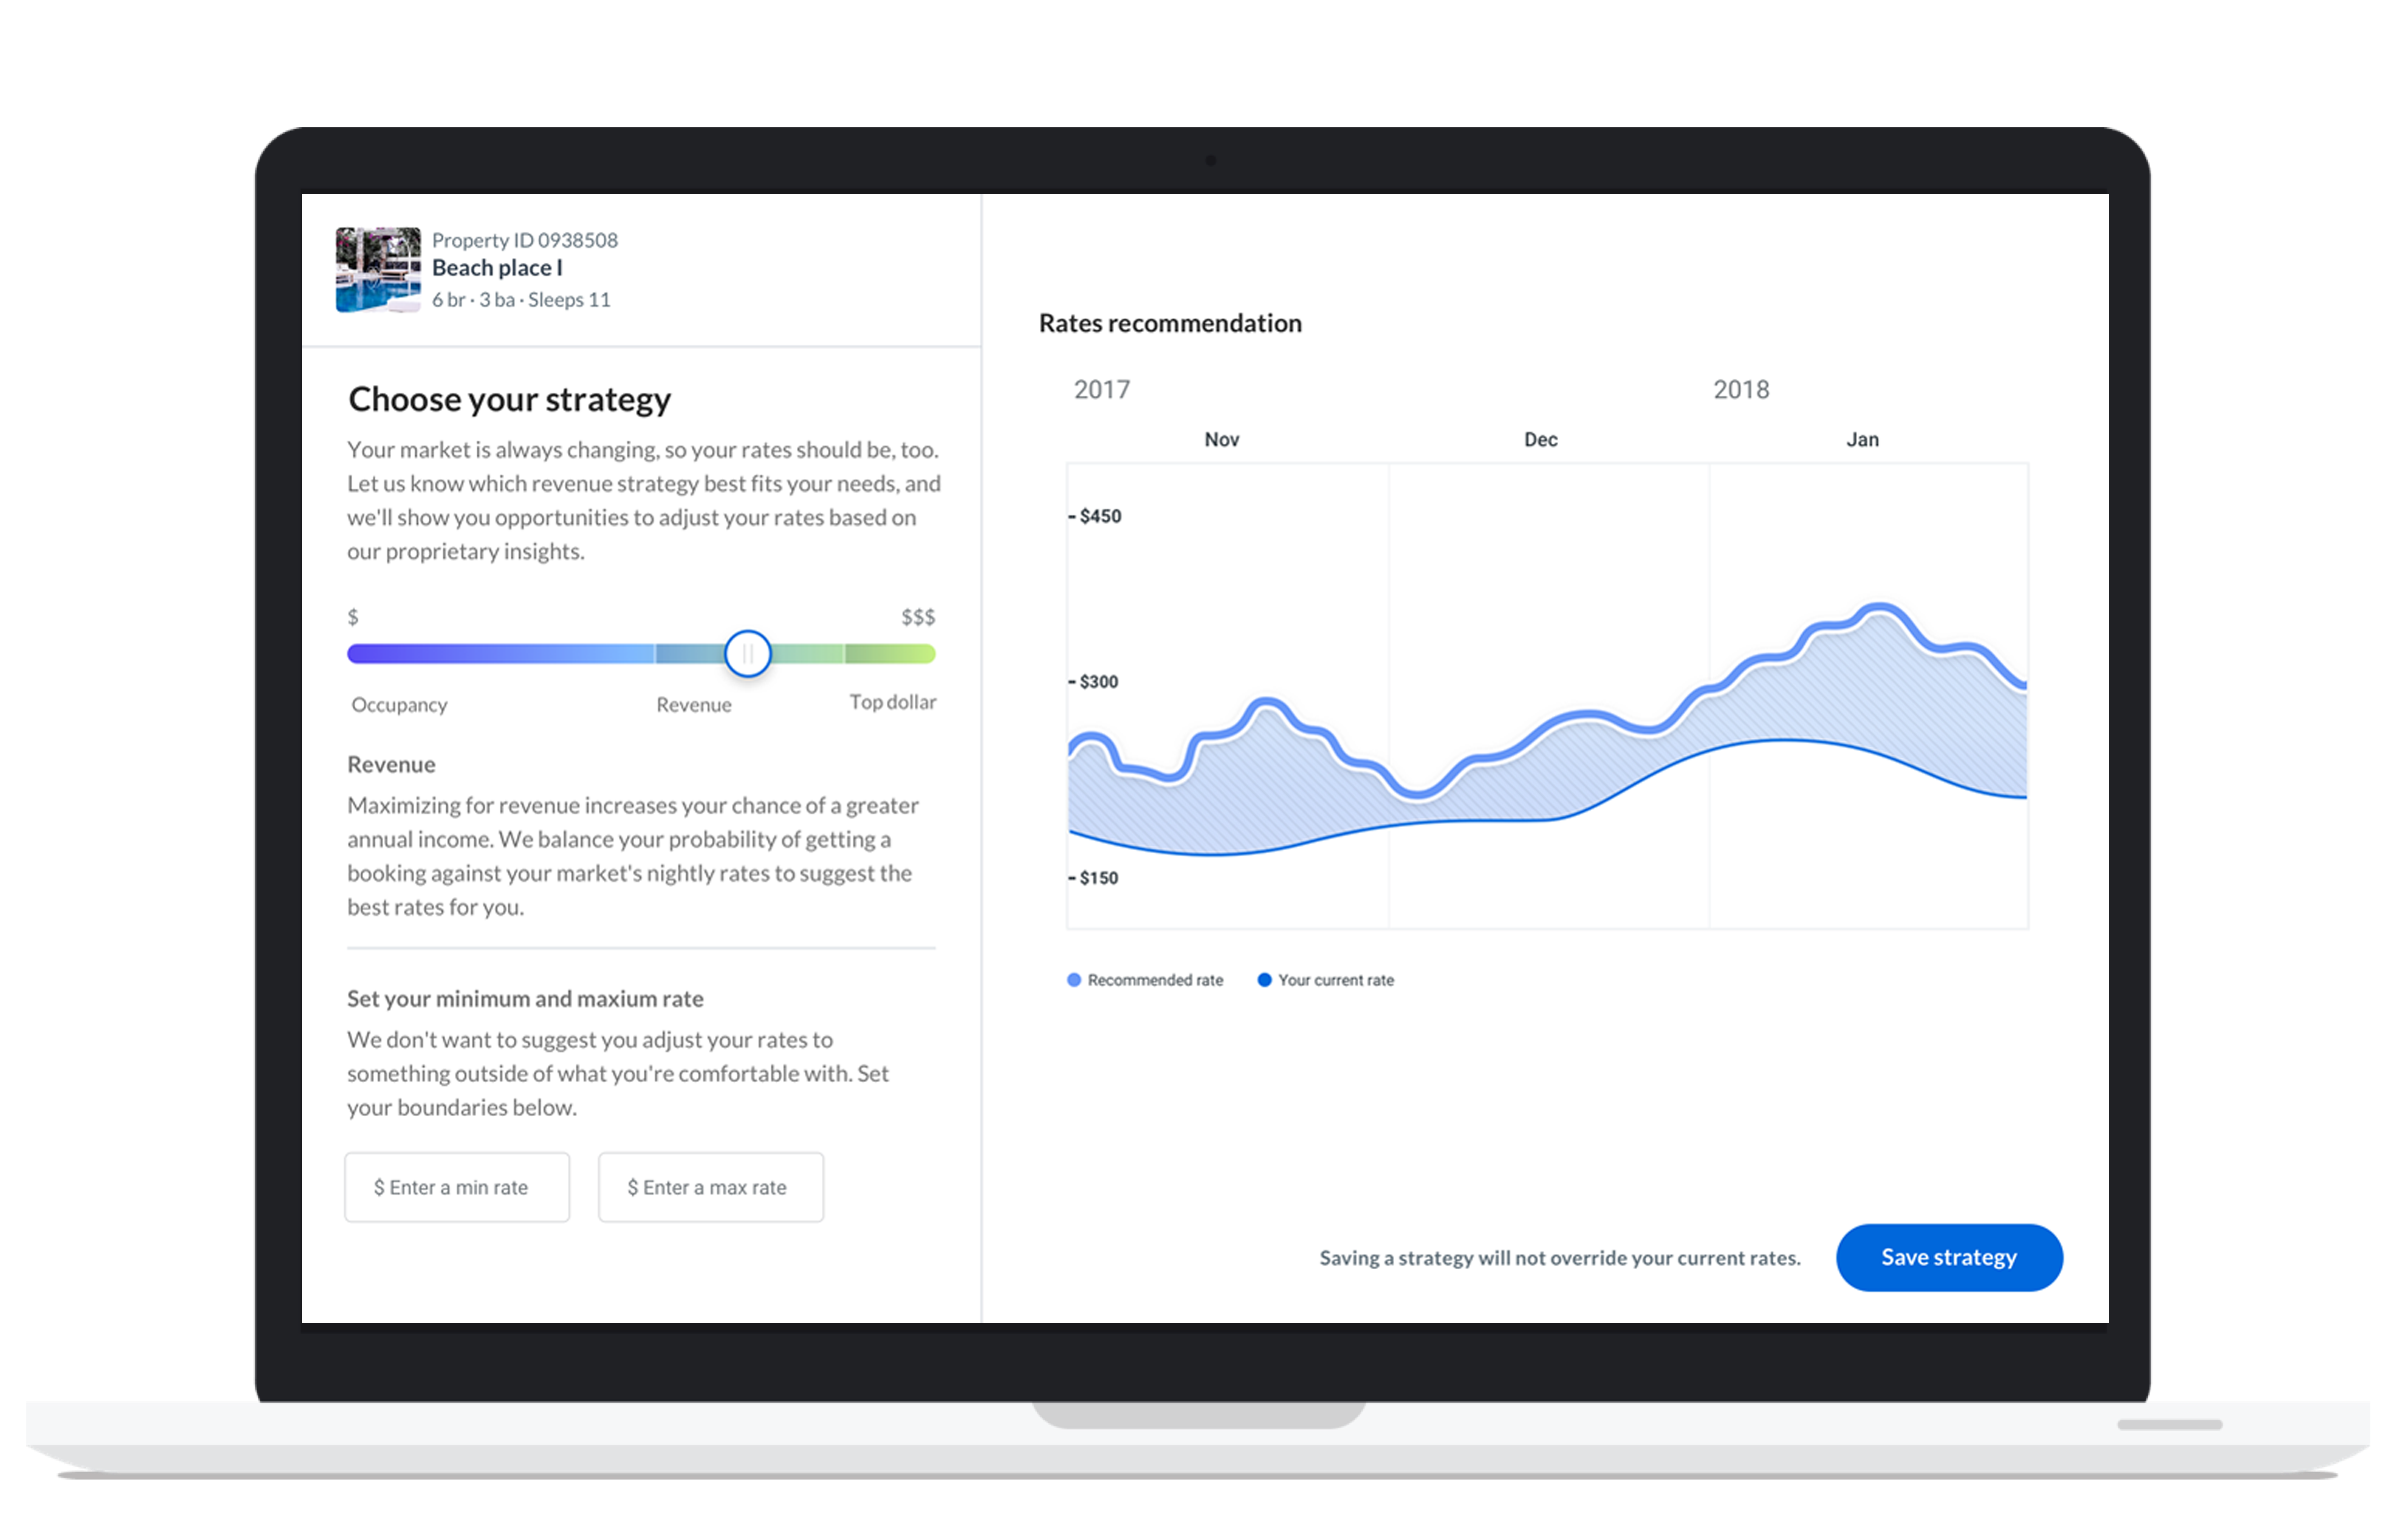
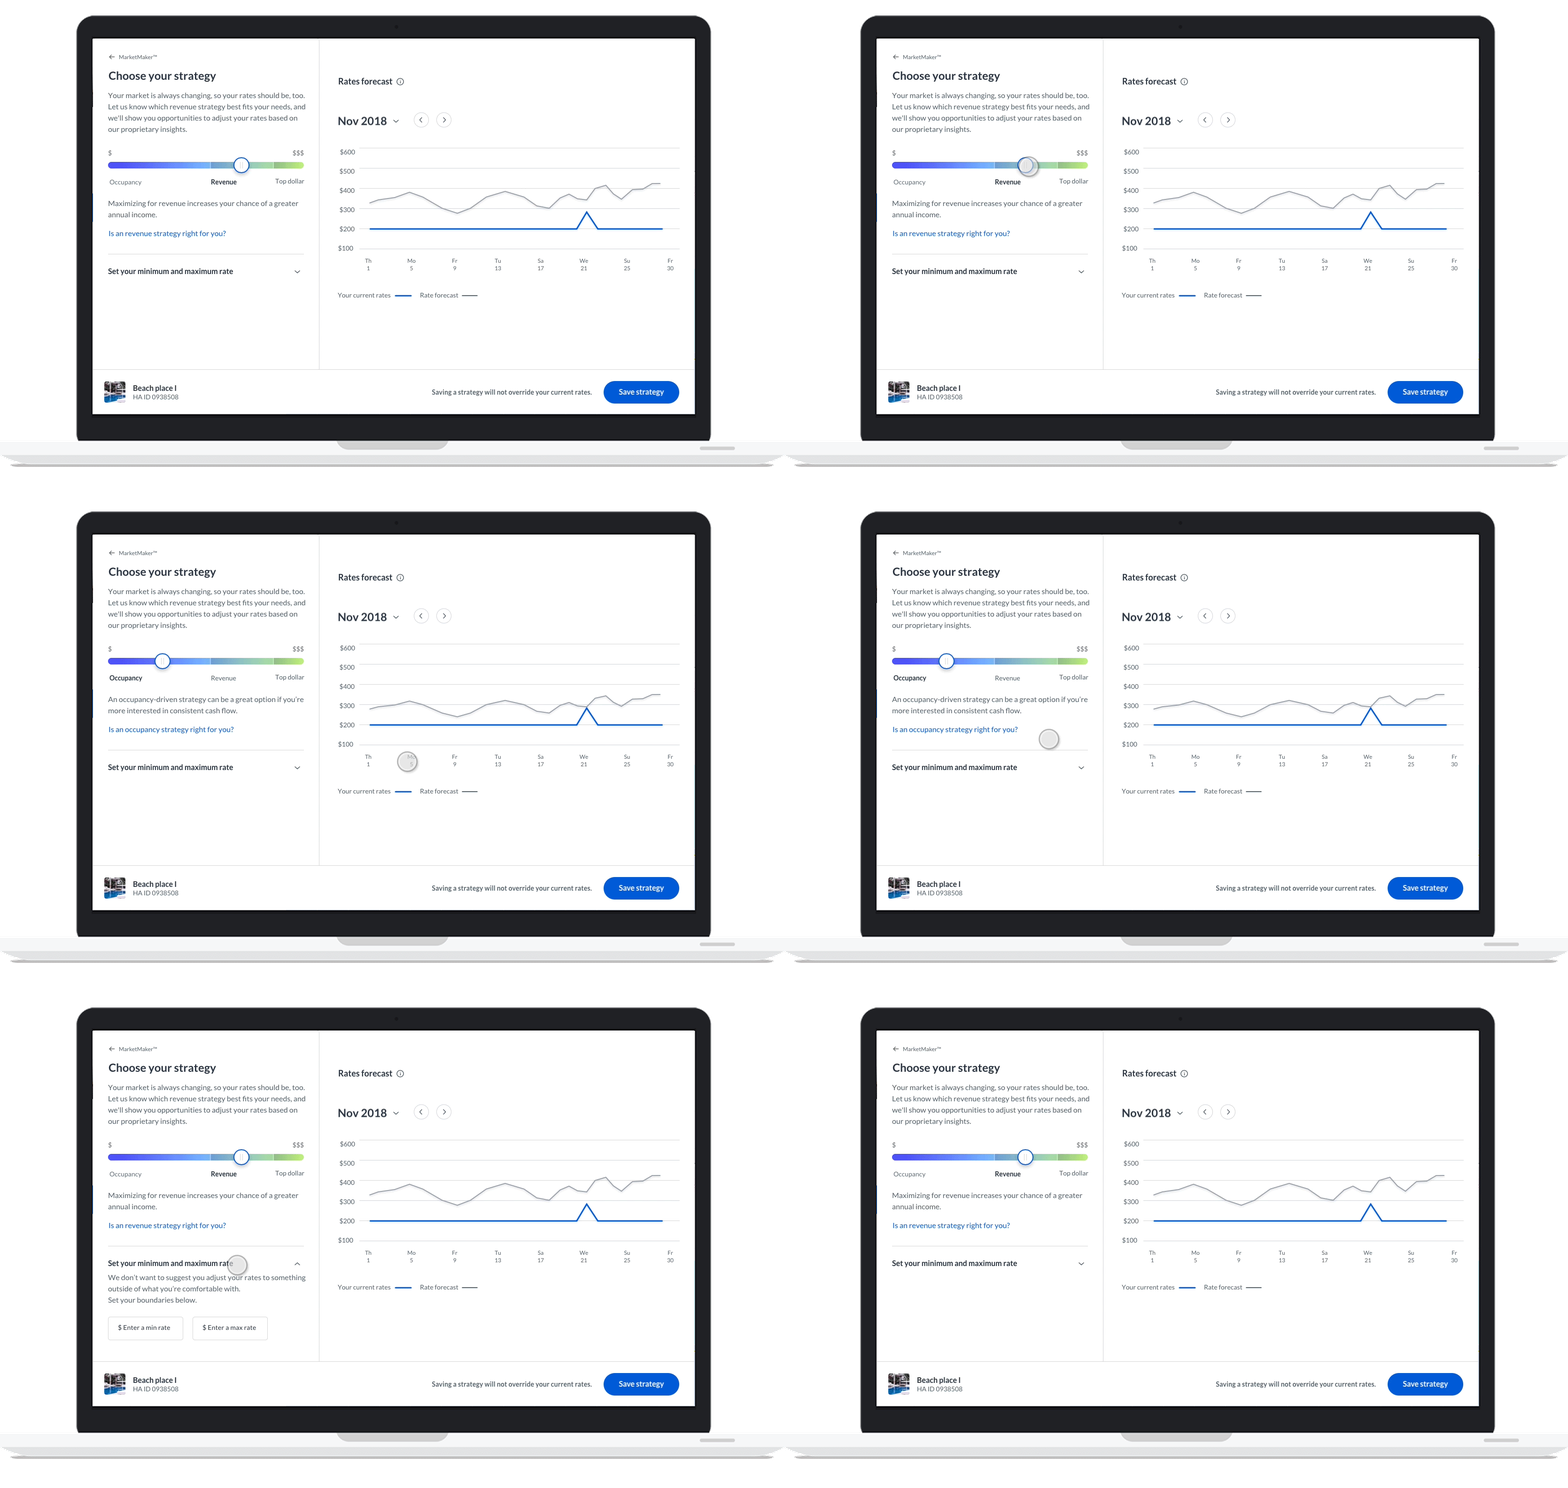
Revenue Strategy is a tool that allows owners to choose a revenue strategy and control min and max rate recommendations that best fit their needs.
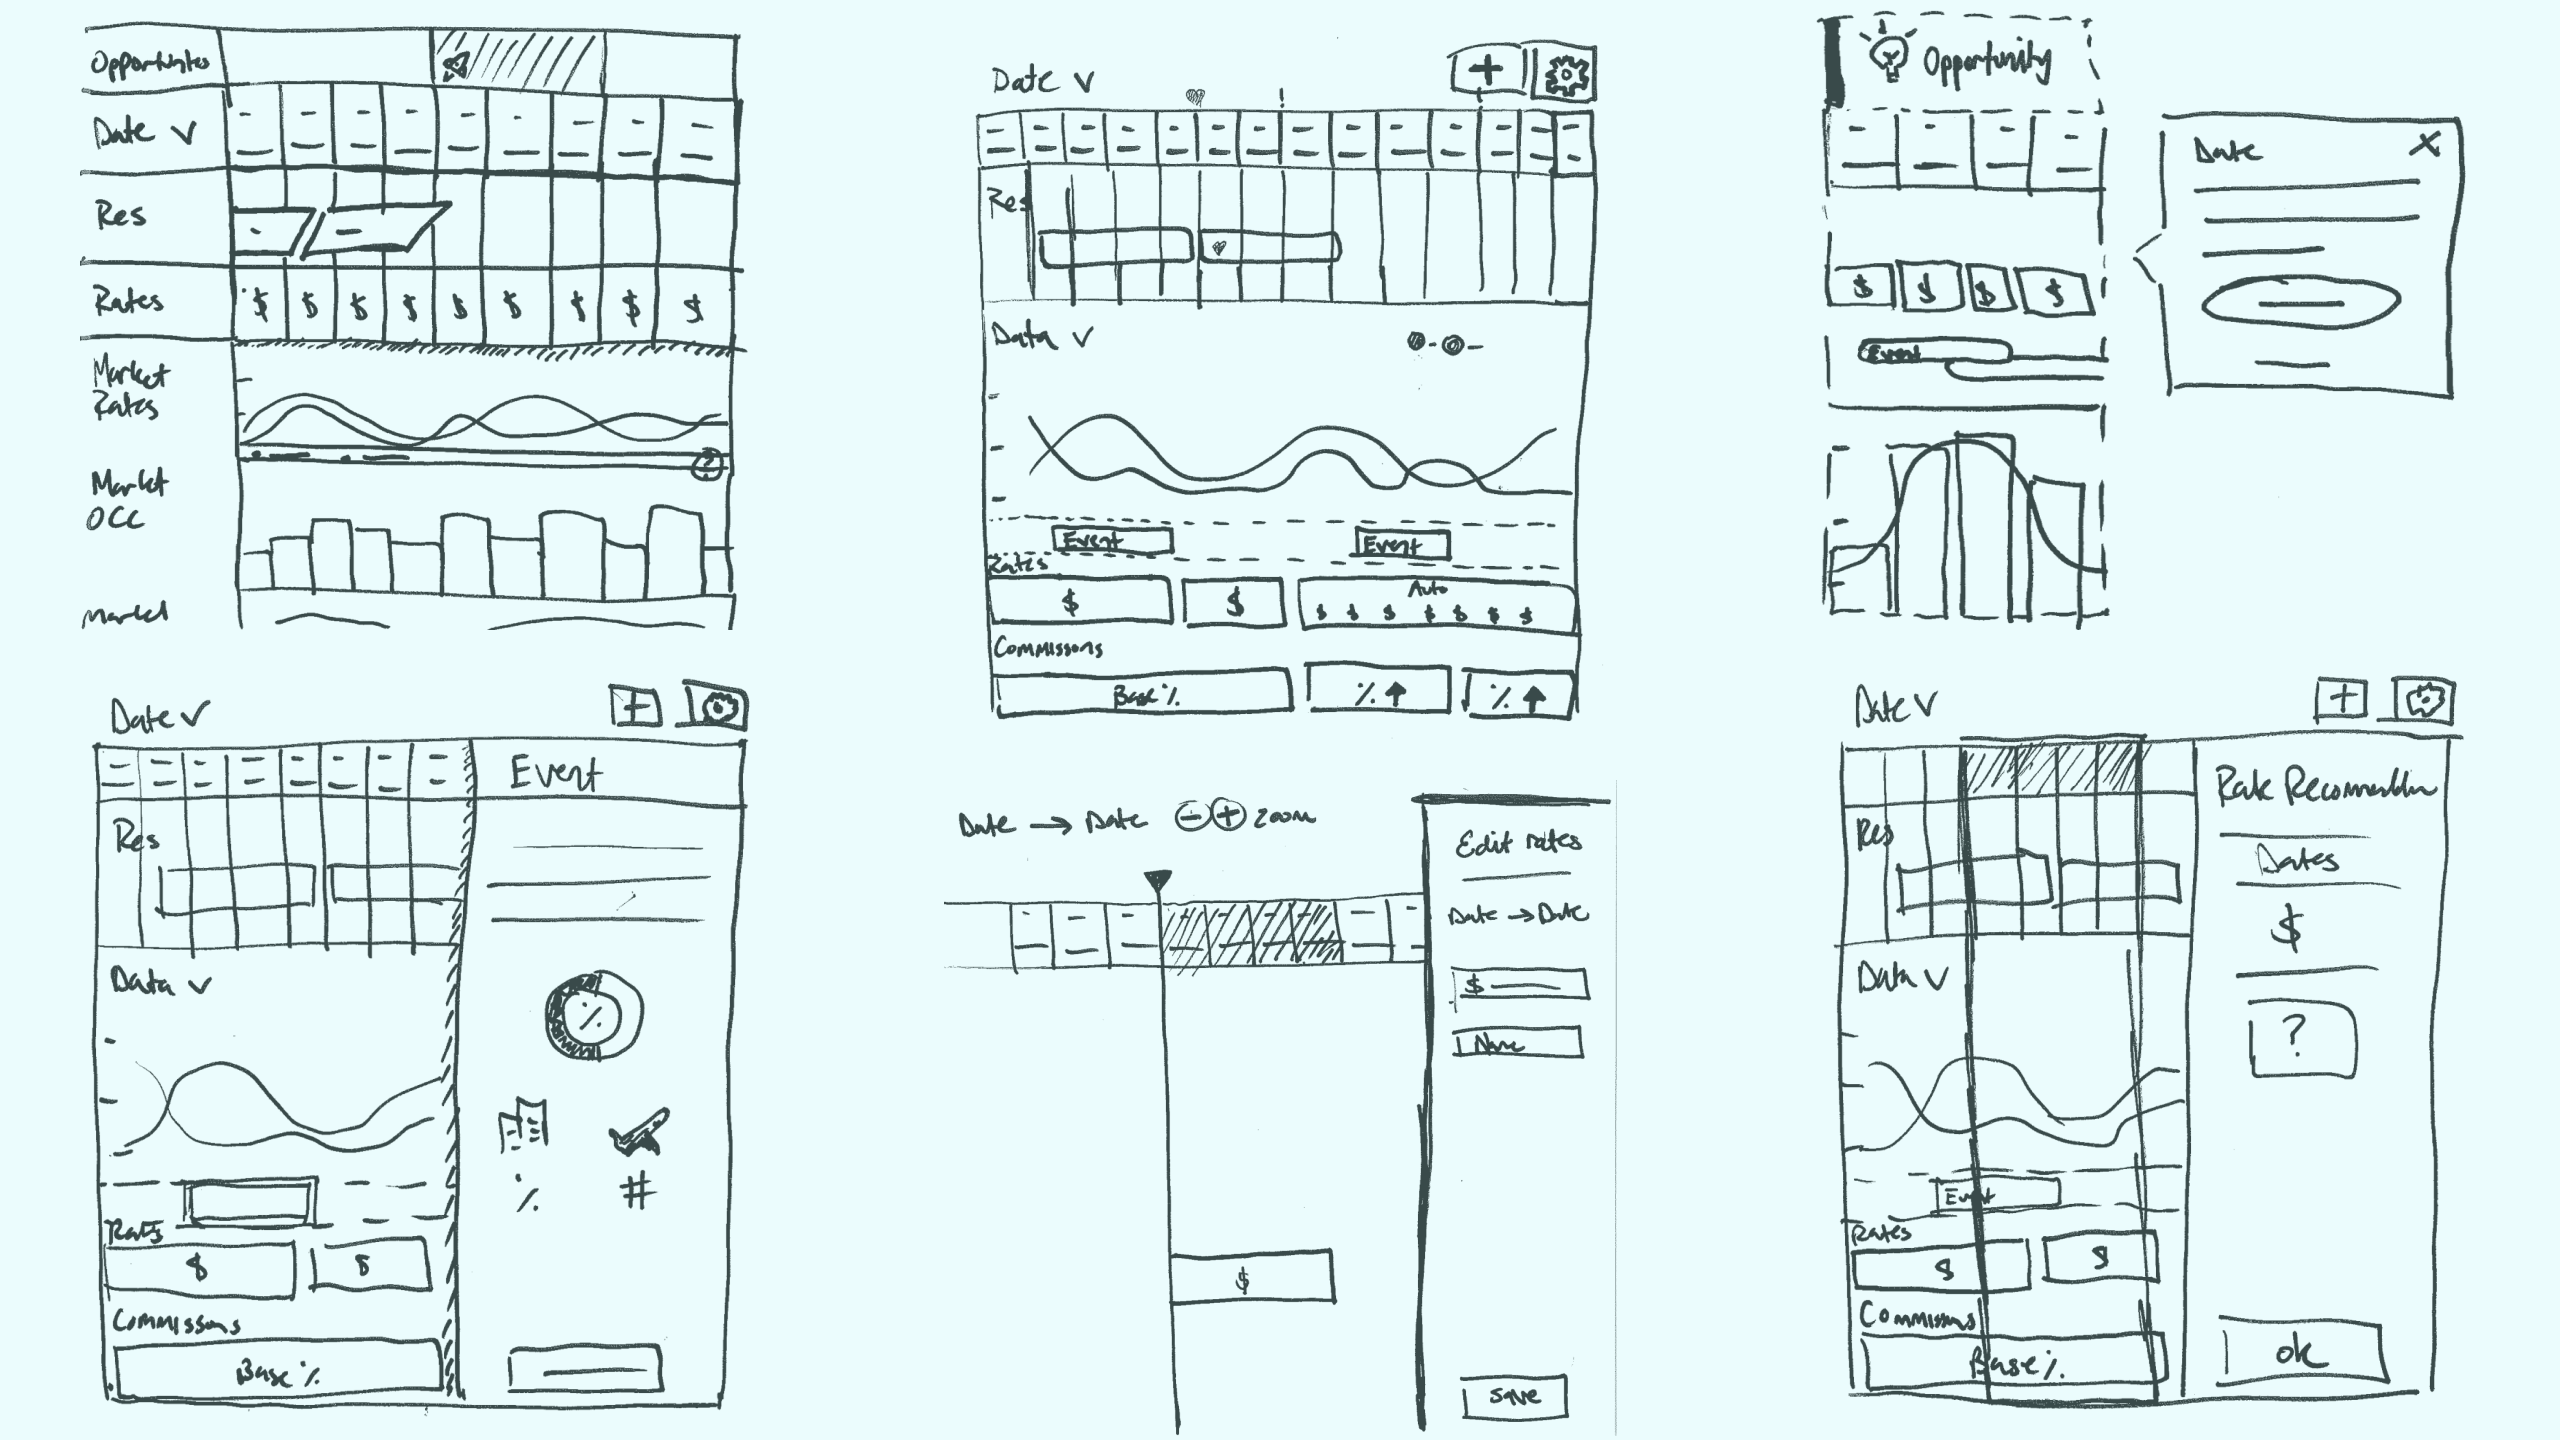
I enjoy sketching, building wireframes, and making low-fidelity prototypes first. I find it more efficient to iterate and it prevents me from getting too attached to one idea or direction. Design is not always about pixel-perfect prototypes. This also helps take subjective feedback out of the equation when getting buy-in from leadership.
Key takeaways from usability studies
Market Maker
Overall, owners responded positively to the idea of HomeAway providing rate recommendations based on competitive data.
Align content and data labels with our customer's mental models. I helped persuade product management to align with content and label changes.
Focus on further simplifying the UX/UI
“Too much happening … too much info coming at me at once. There is no center point drawing me in… too complicated.”
Competitive Set
Don’t assume to know owner's competition.
Owners need more control over the list of properties: Such as filtering, adding, and removing properties.
Give definitions behind match % and why properties are similar.
Owners need an easy way to compare other properties.
“I can't view the properties properly to understand if they are my competition or not and therefore if I can remove them or not.”
Revenue Strategy
The revenue strategy graph was hard to read without their current rates.
Min and max rates were nice because they gave users control over rate recommendation limits.
Most users would prefer to choose a revenue-maximizing strategy.
Find a way to simplify the experience for setting a price strategy experience.
“Helping choose a strategy to change rates may be helpful…. I like the idea of HomeAway suggesting rates.”
CONTINUOUS DISCOVERY
After a product launch, it's important to capture data and feedback. This will help the product team make data-driven decisions when it comes to improving and optimizing the experience. With months of collected feedback and page analytics, I was able to facilitate a design thinking workshop. These workshops work best when there are a variety of different roles and perspectives coming together to brainstorm. I made sure to invite the entire product team including the customer success and marketing teams. I facilitated an all-day workshop. Two major themes emerged.
FIRST THEME
Increasing owner engagement
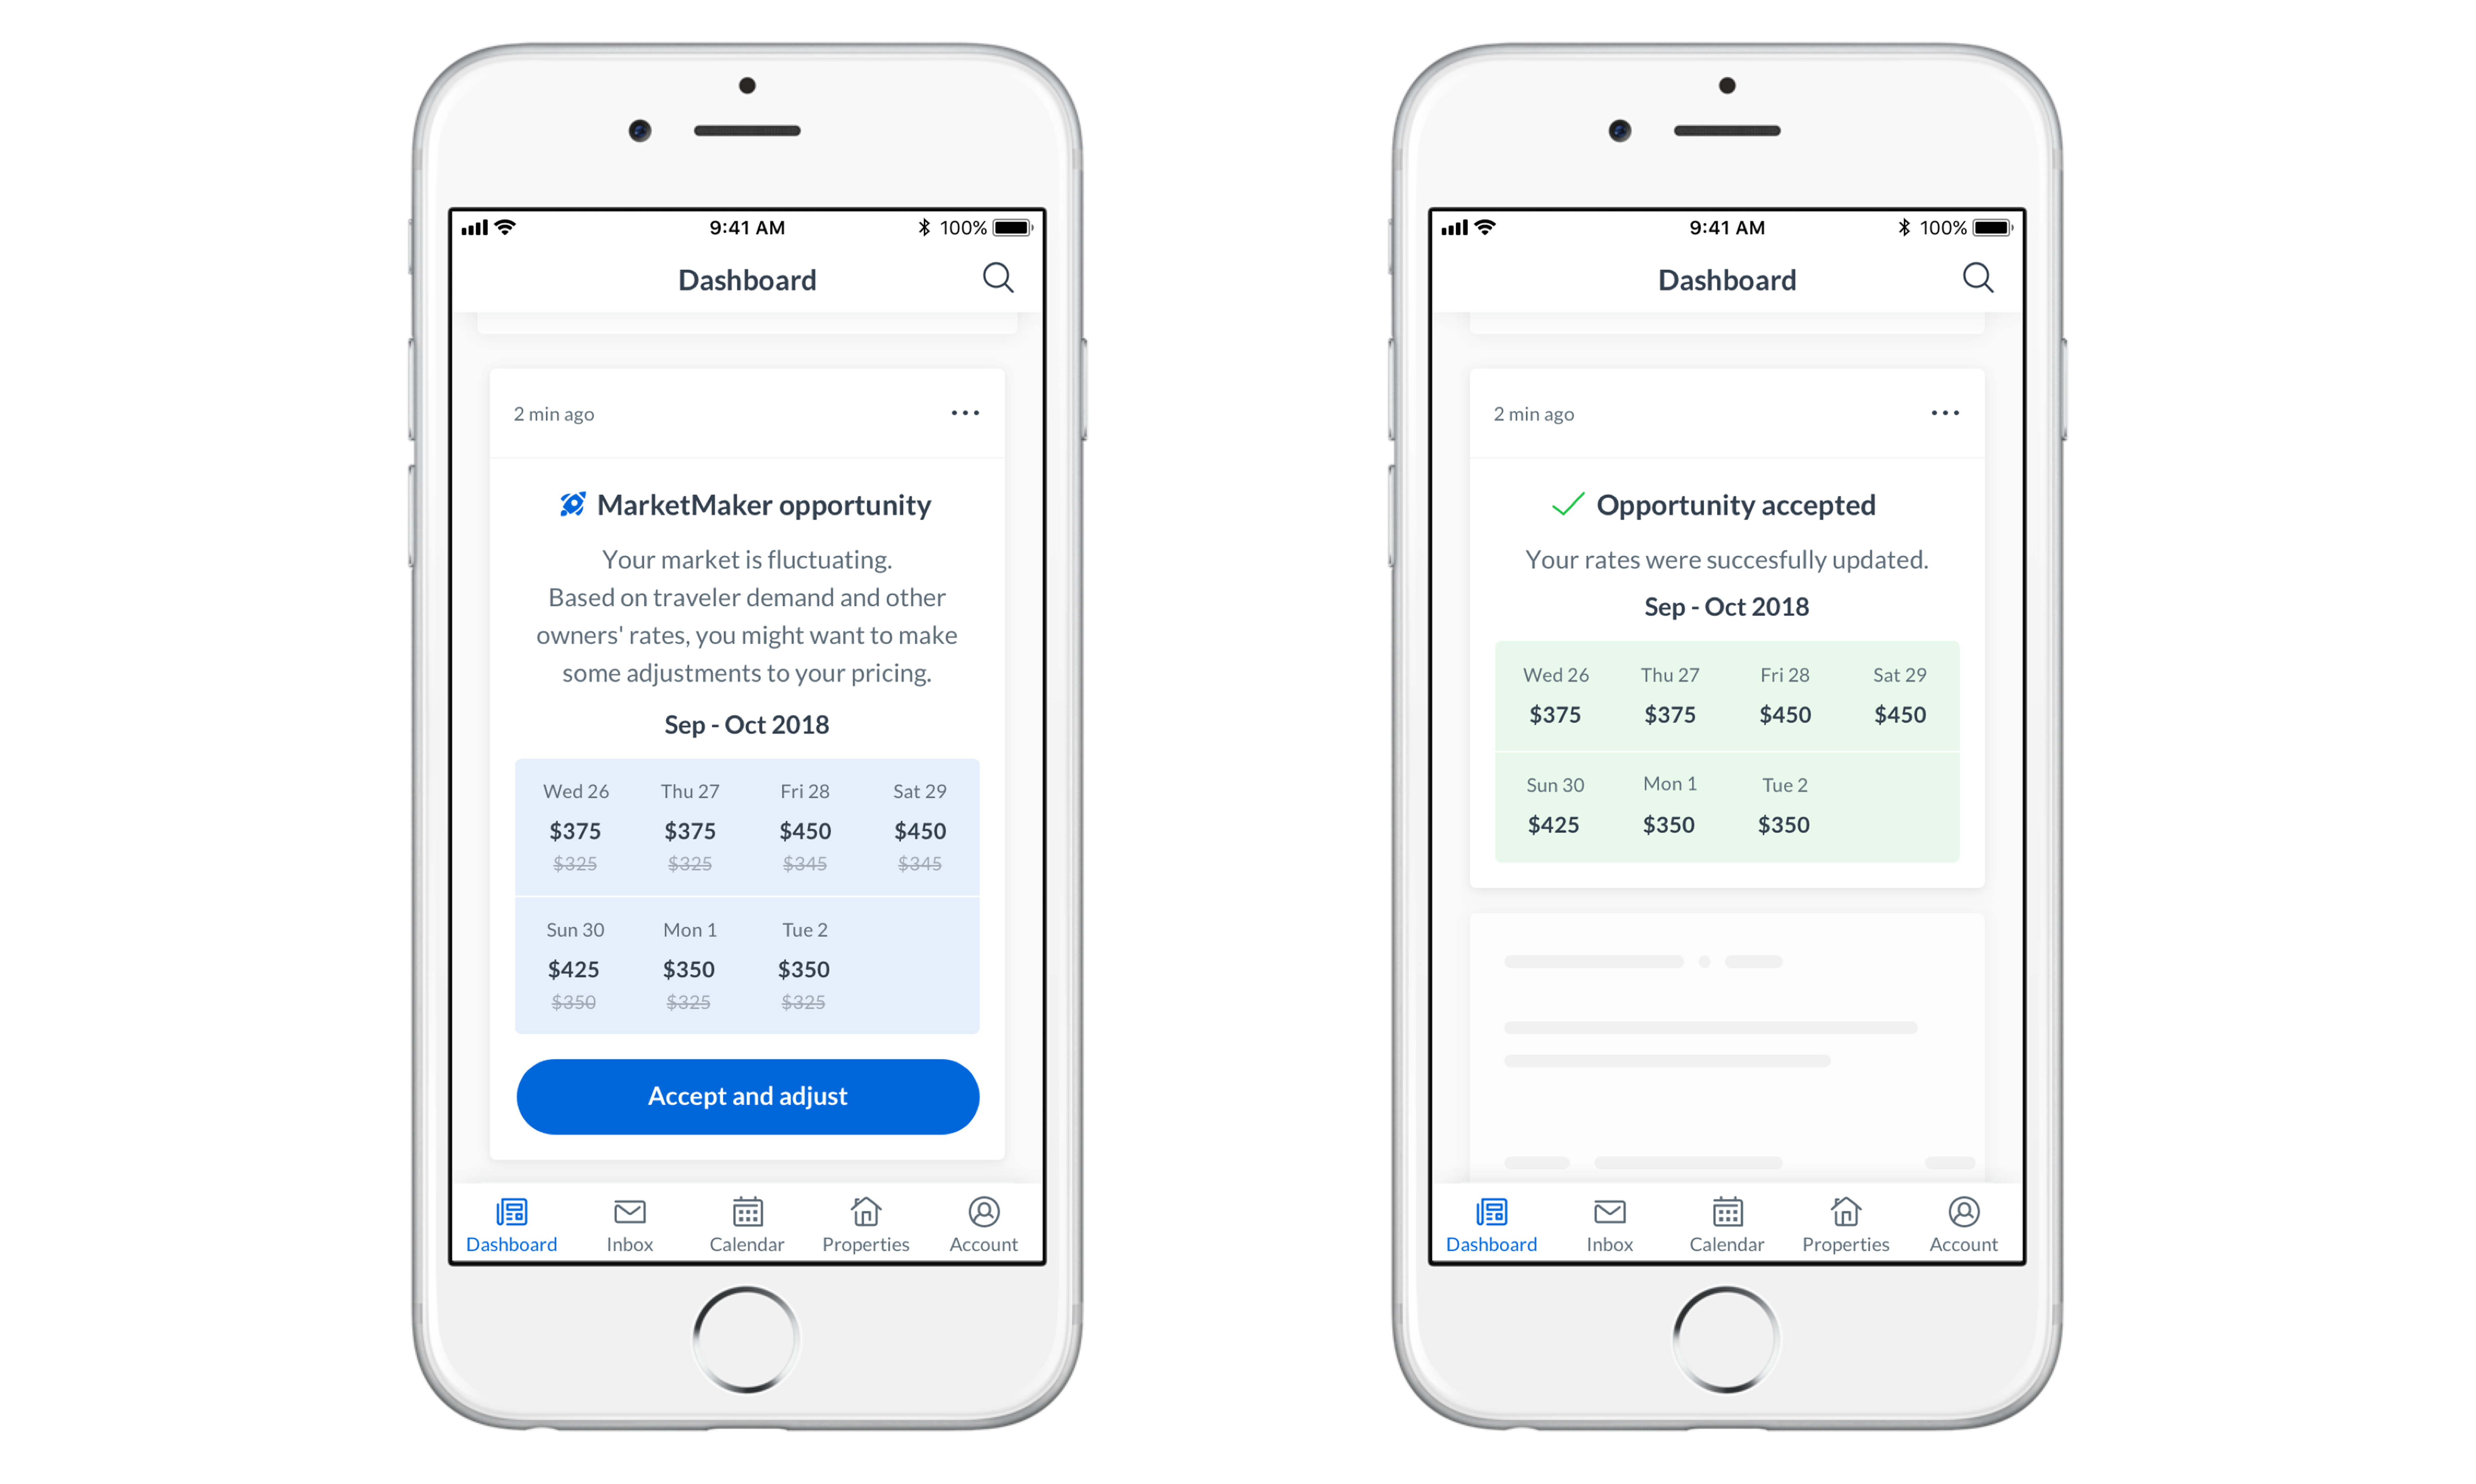
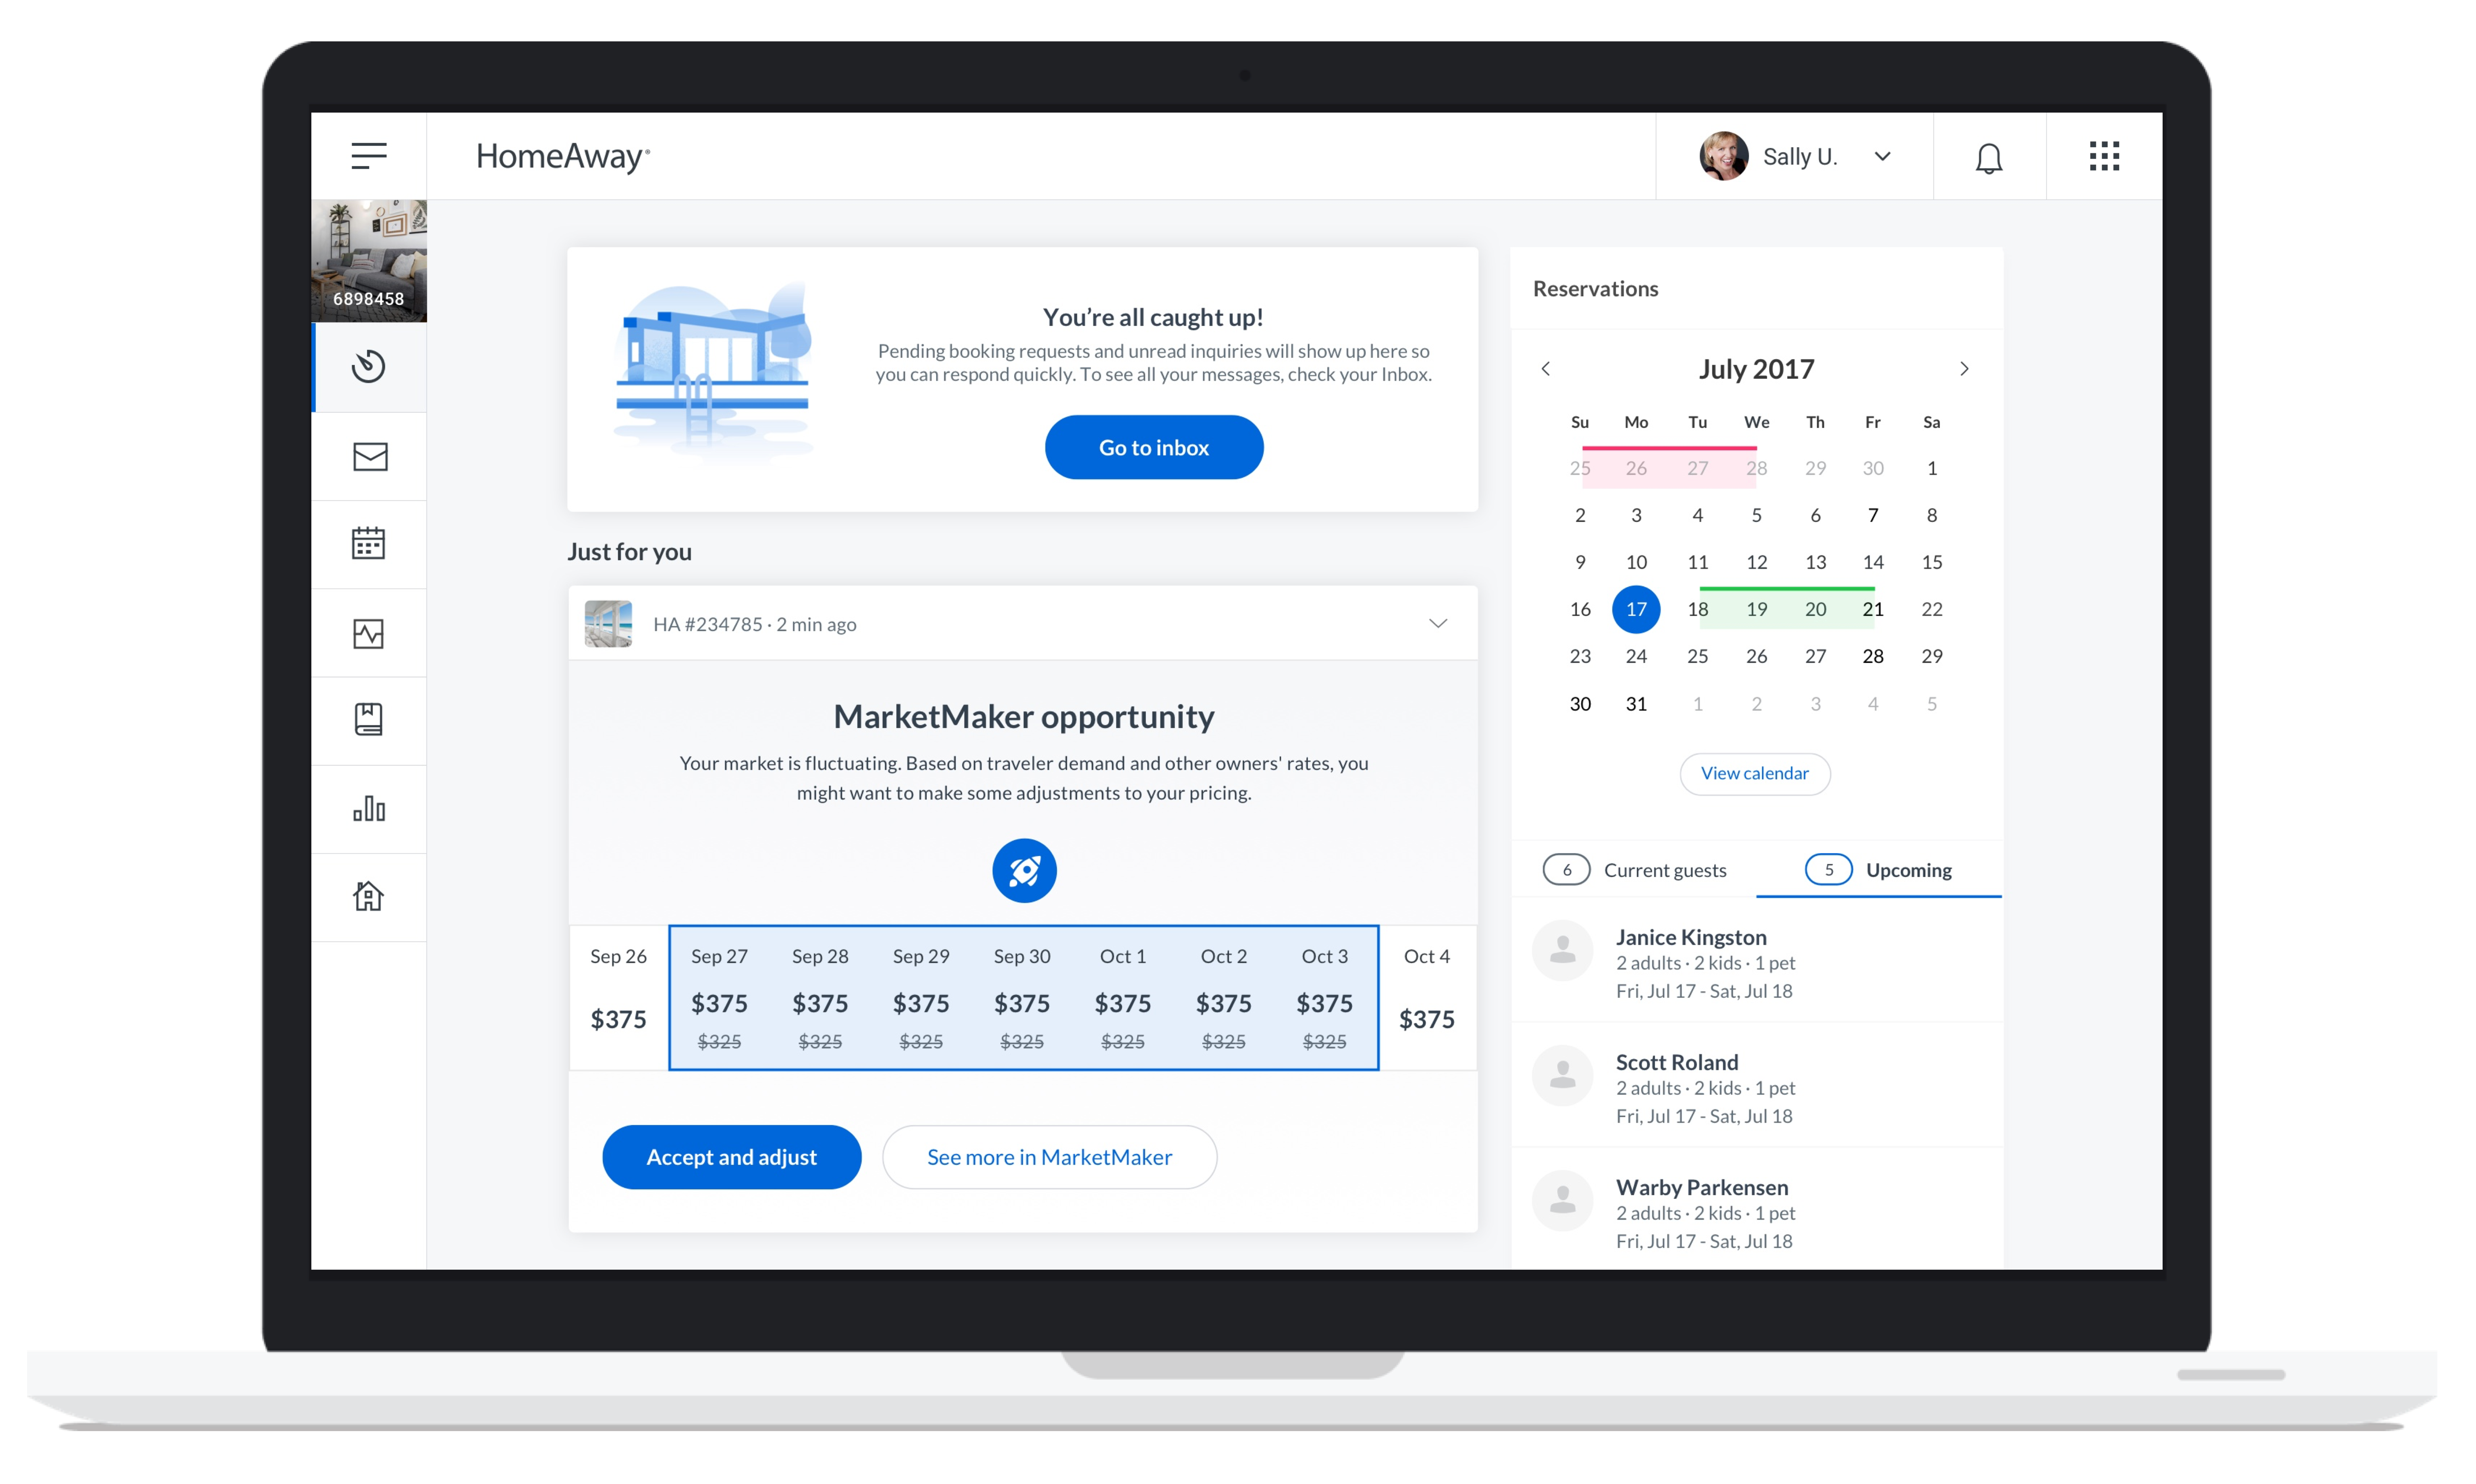
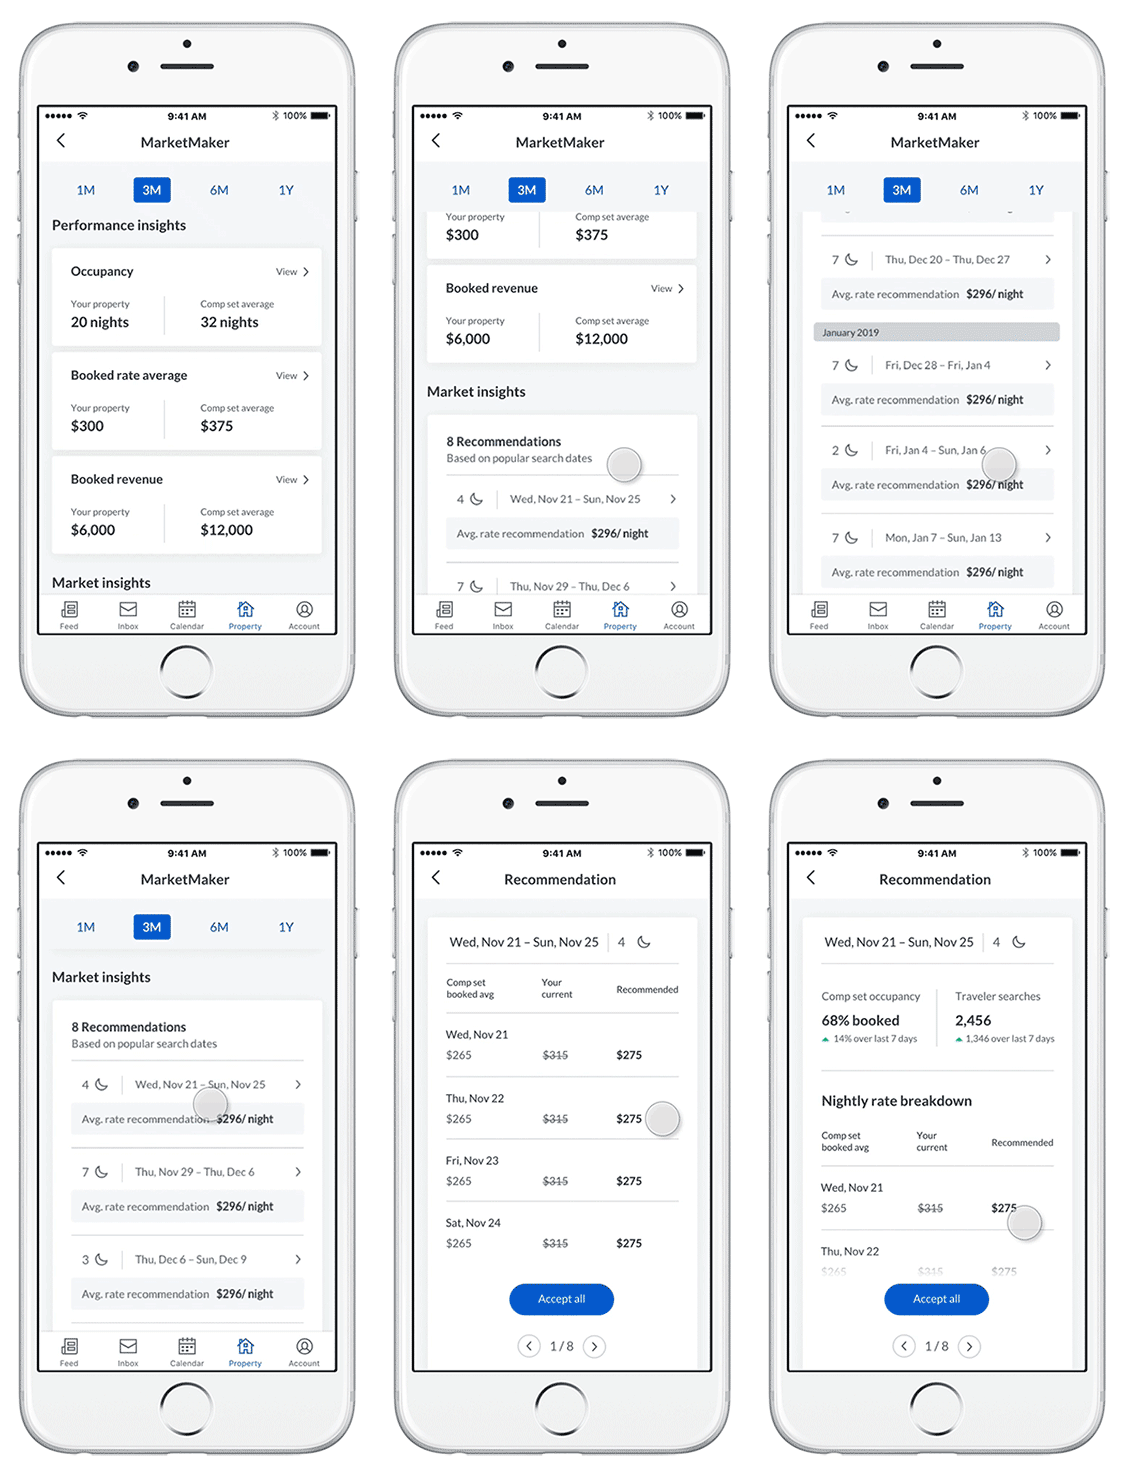
Add MarketMaker rate recommendations to the owner dashboard for web and app.
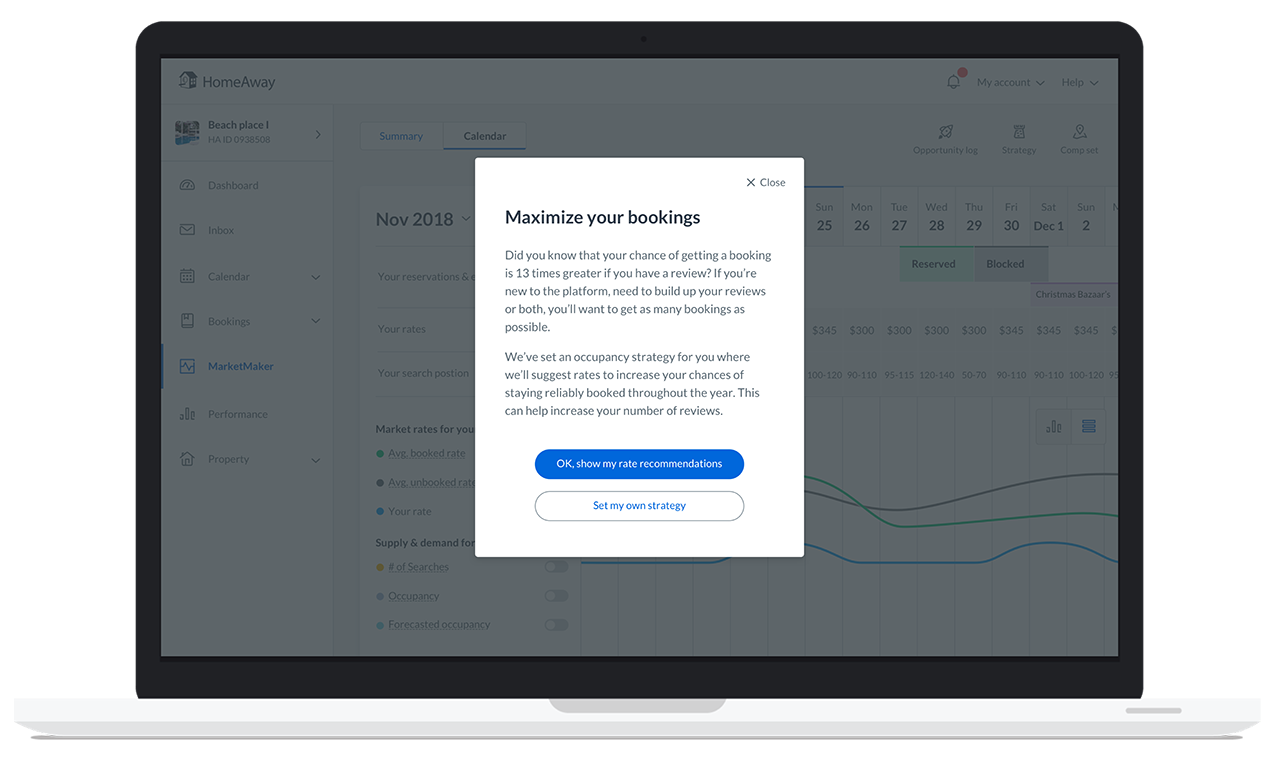
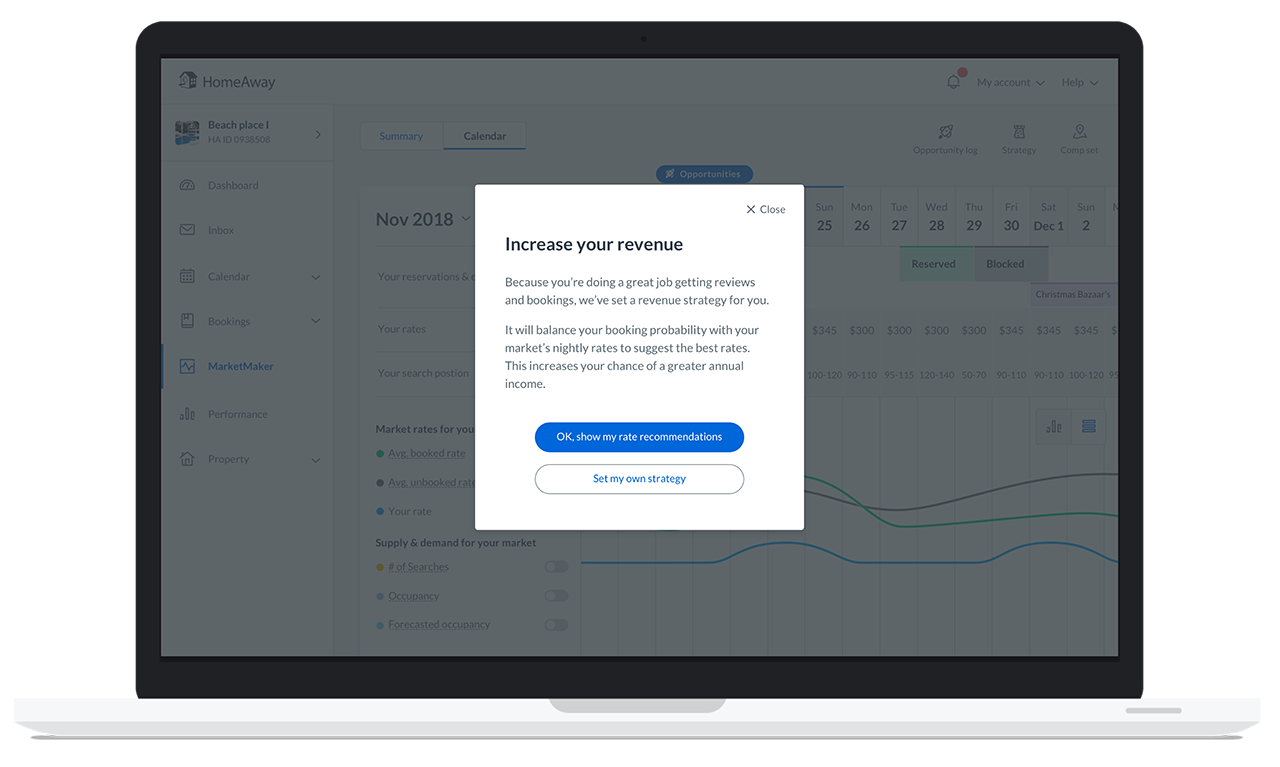
Don't require a strategy to be selected. Default new owners into an occupancy strategy and existing owners that met a certain revenue threshold to a revenue-maximizing strategy. For power users, allow for custom strategies to be set.
Optimize MarketMaker and Competitive sets for the mobile web and the iOS/ Android apps.
SECOND THEME
Simplifying the experience
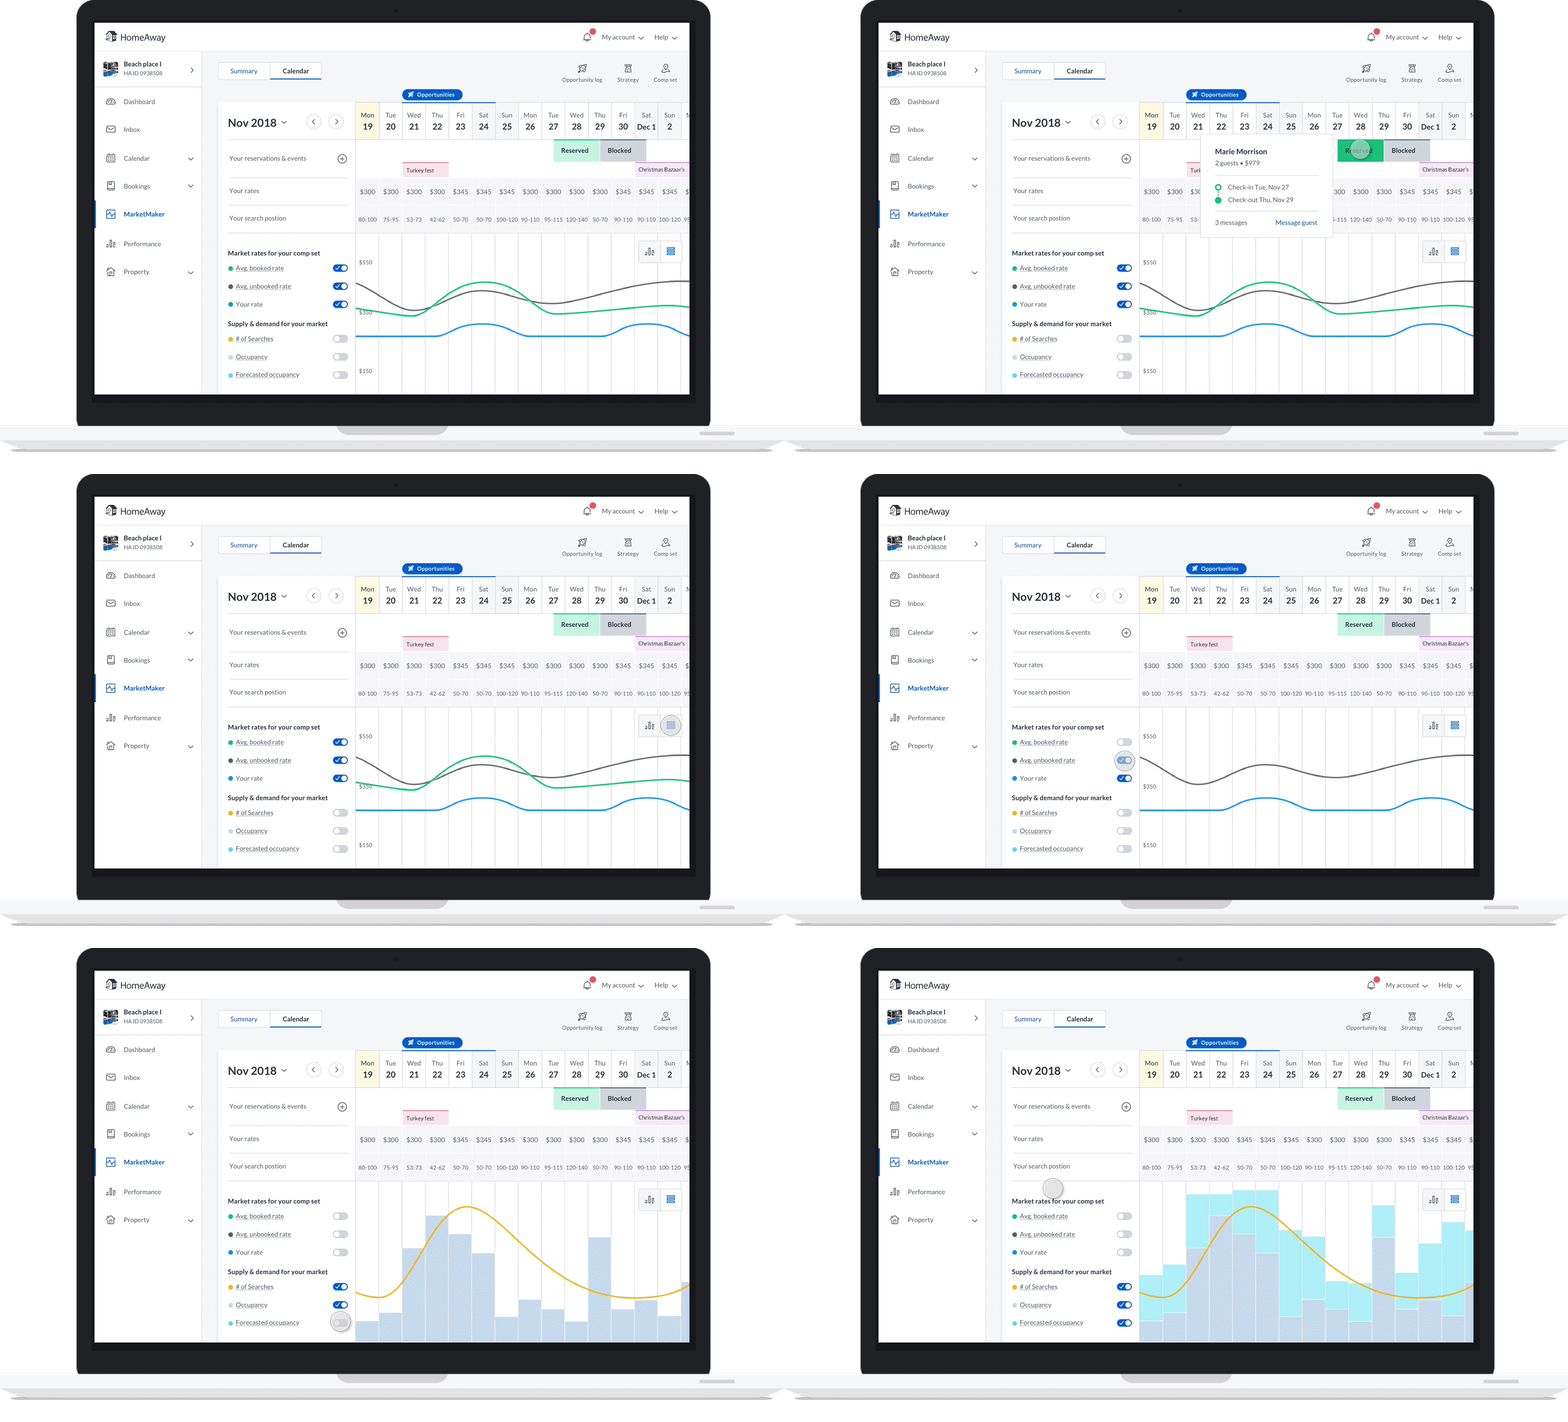
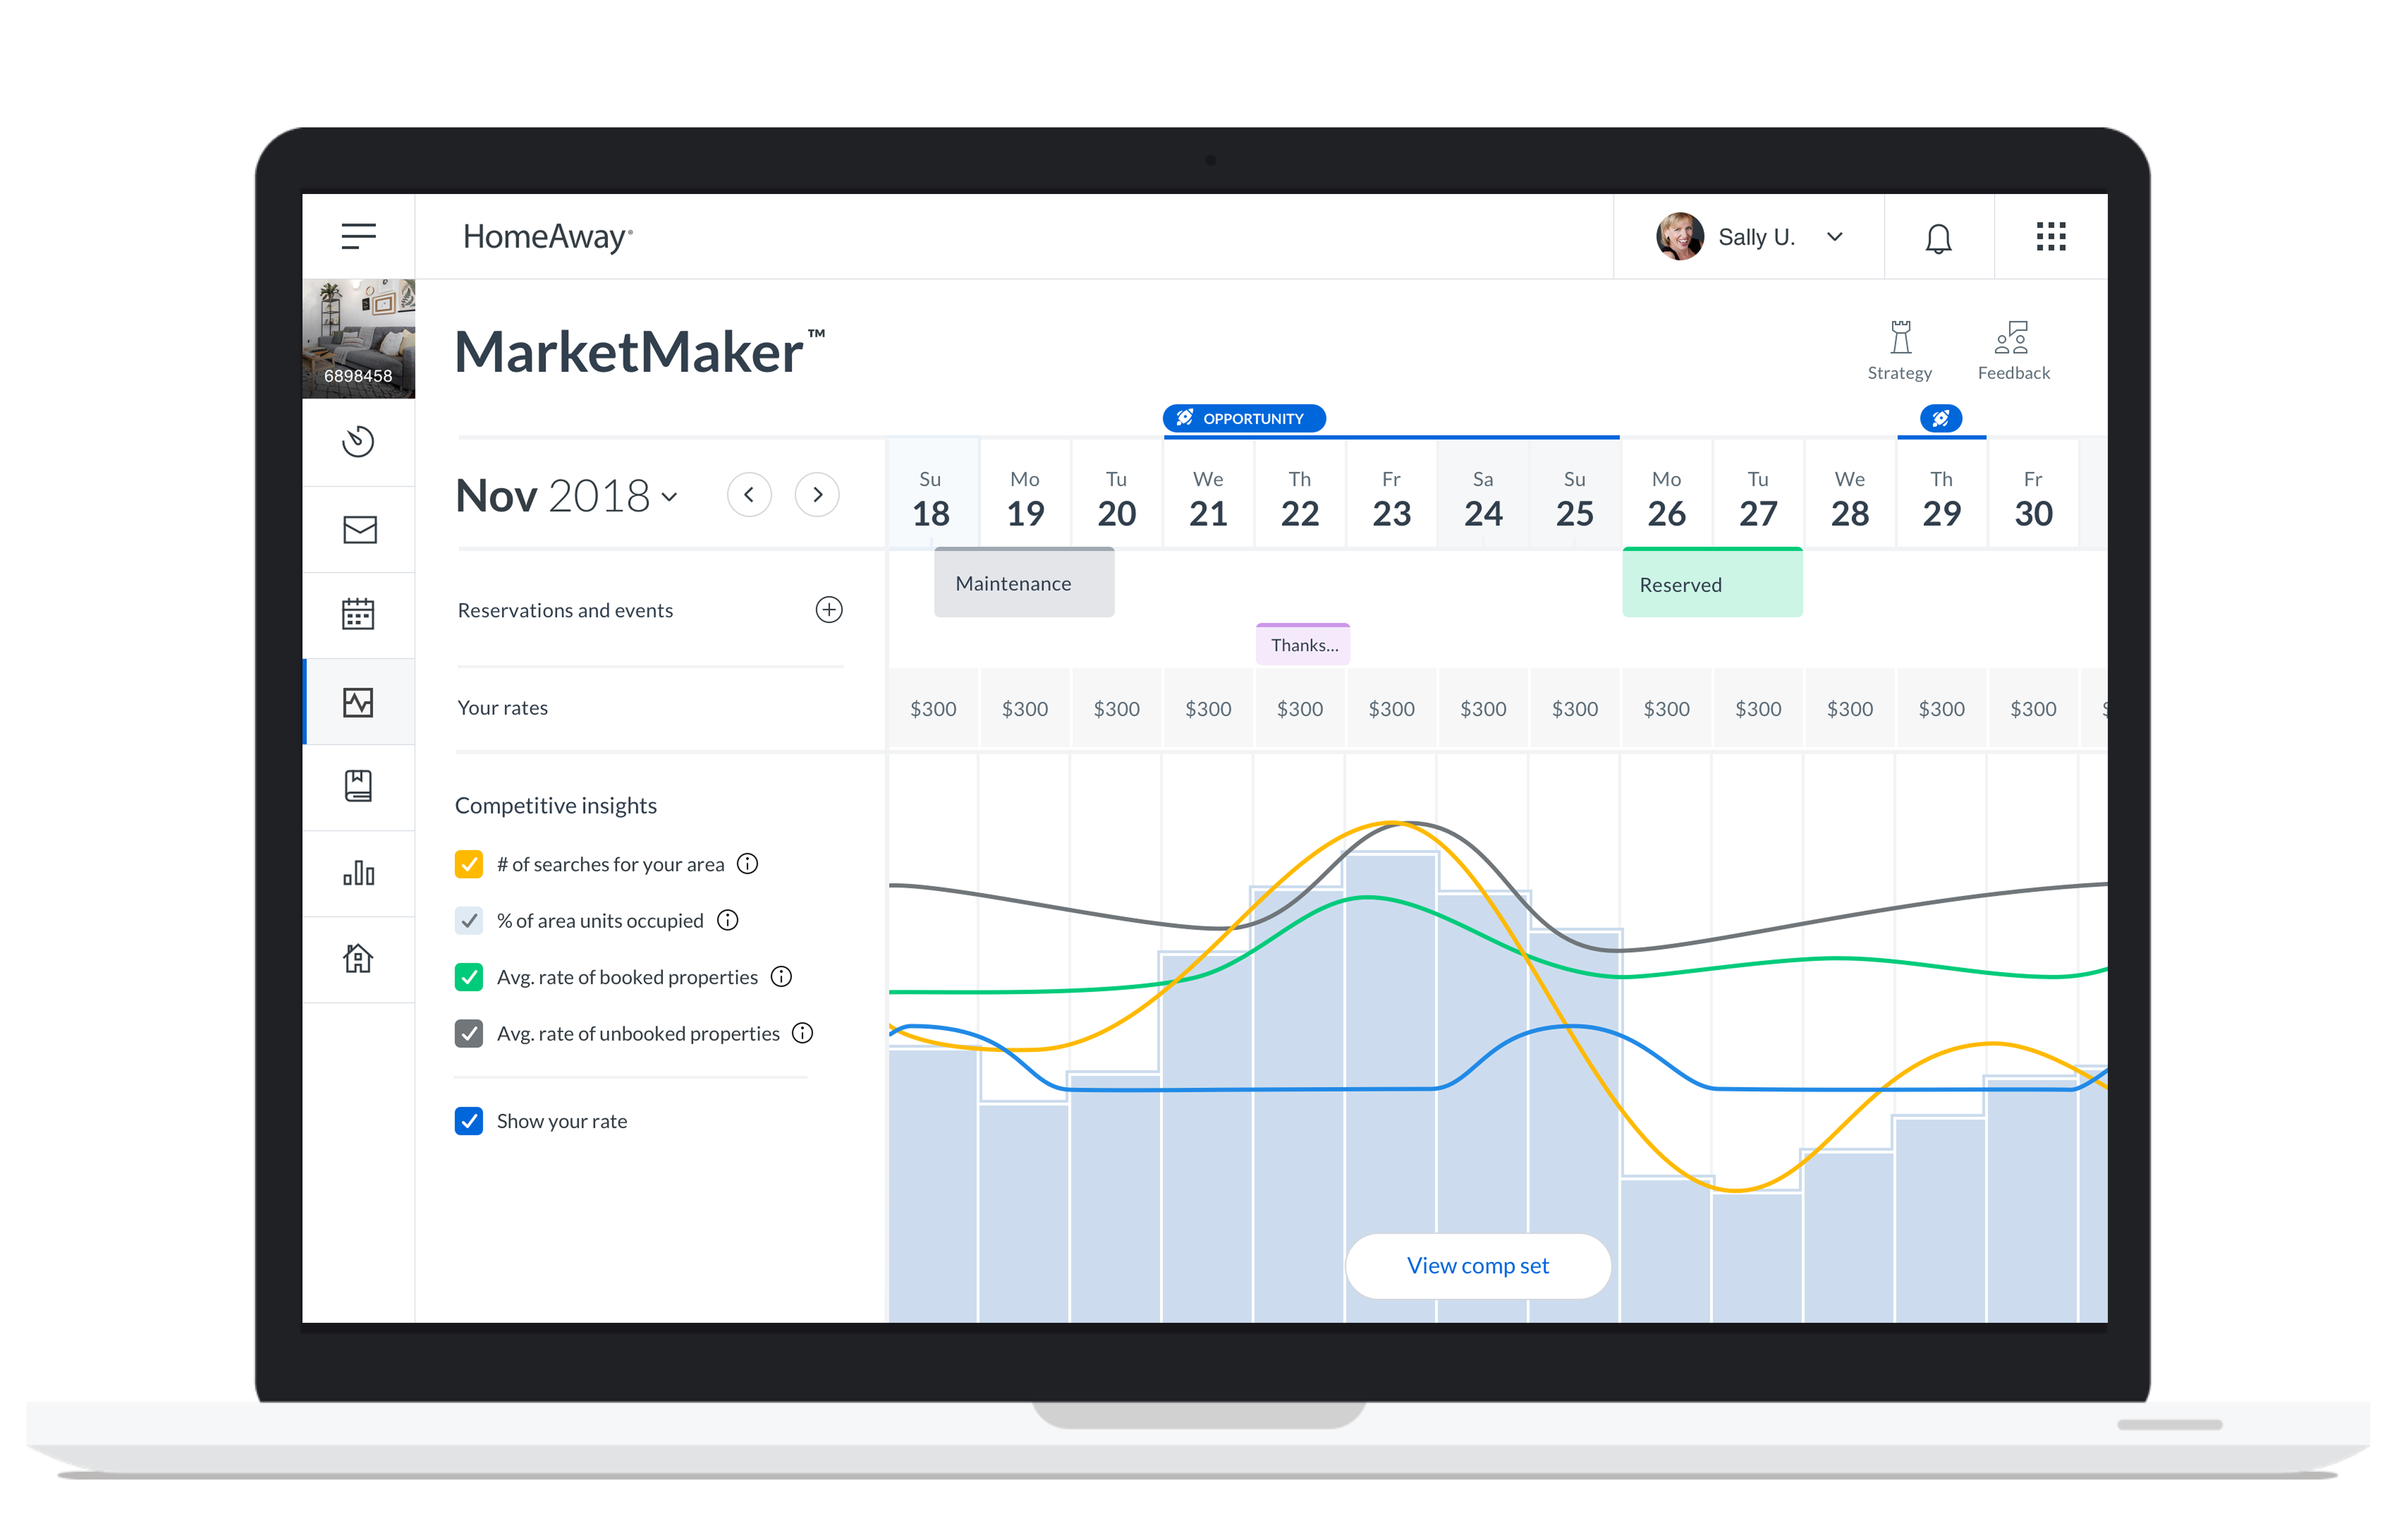
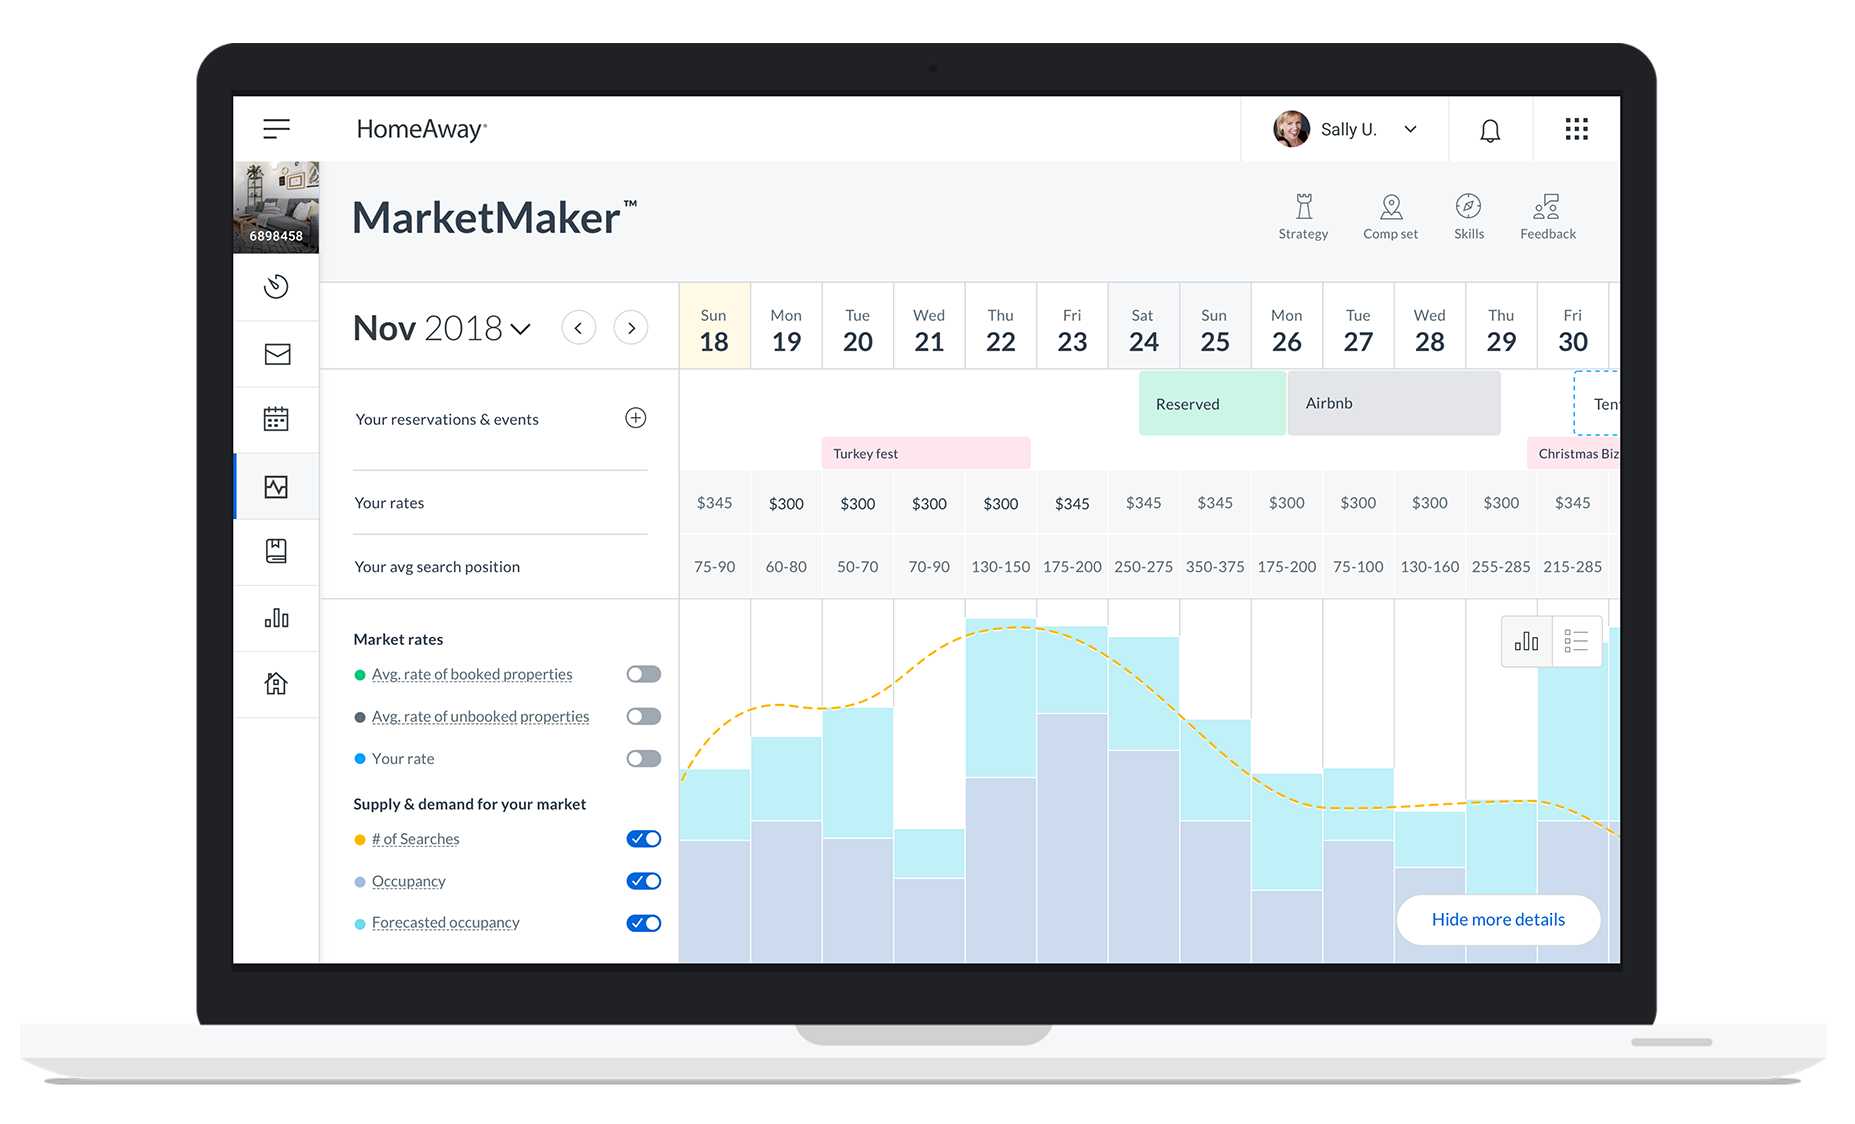
Seperate the legend from the checkbox in the competitive insights graph and update checkboxes to toggle switches.
Give owners who have trouble reading data visualization the option to toggle between a visual graph and a data table.
Create a summary view to show the total number of opportunities and aggregated data about their revenue compared to their competition instead of data visualization.
Give owners an easier way to filter, compare, and edit properties in their competitive set. Differentiate properties in their comp set from the rest of the properties in their market.

Credit:
Blake Hicks (UX), William Keck (PM), Dr. Anikó Sándor (Research), Kirk Wetherill (Design Technologist), the MarketMaker engineering team, and more.
Thanks for stopping by. Get in touch if you want to chat.
© 2022 Roger That Design


